
BrightAnalytics: a Bizview alternative for consolidated management reporting
Looking for a Bizview alternative? BrightAnalytics is a management reporting platform that brings budgeting, forecasting, reporting, and consolidation together in one place, connected directly to your source systems so your numbers stay accurate and current.
Why companies choose BrightAnalytics
1. Fast to get running, without a heavy implementation project
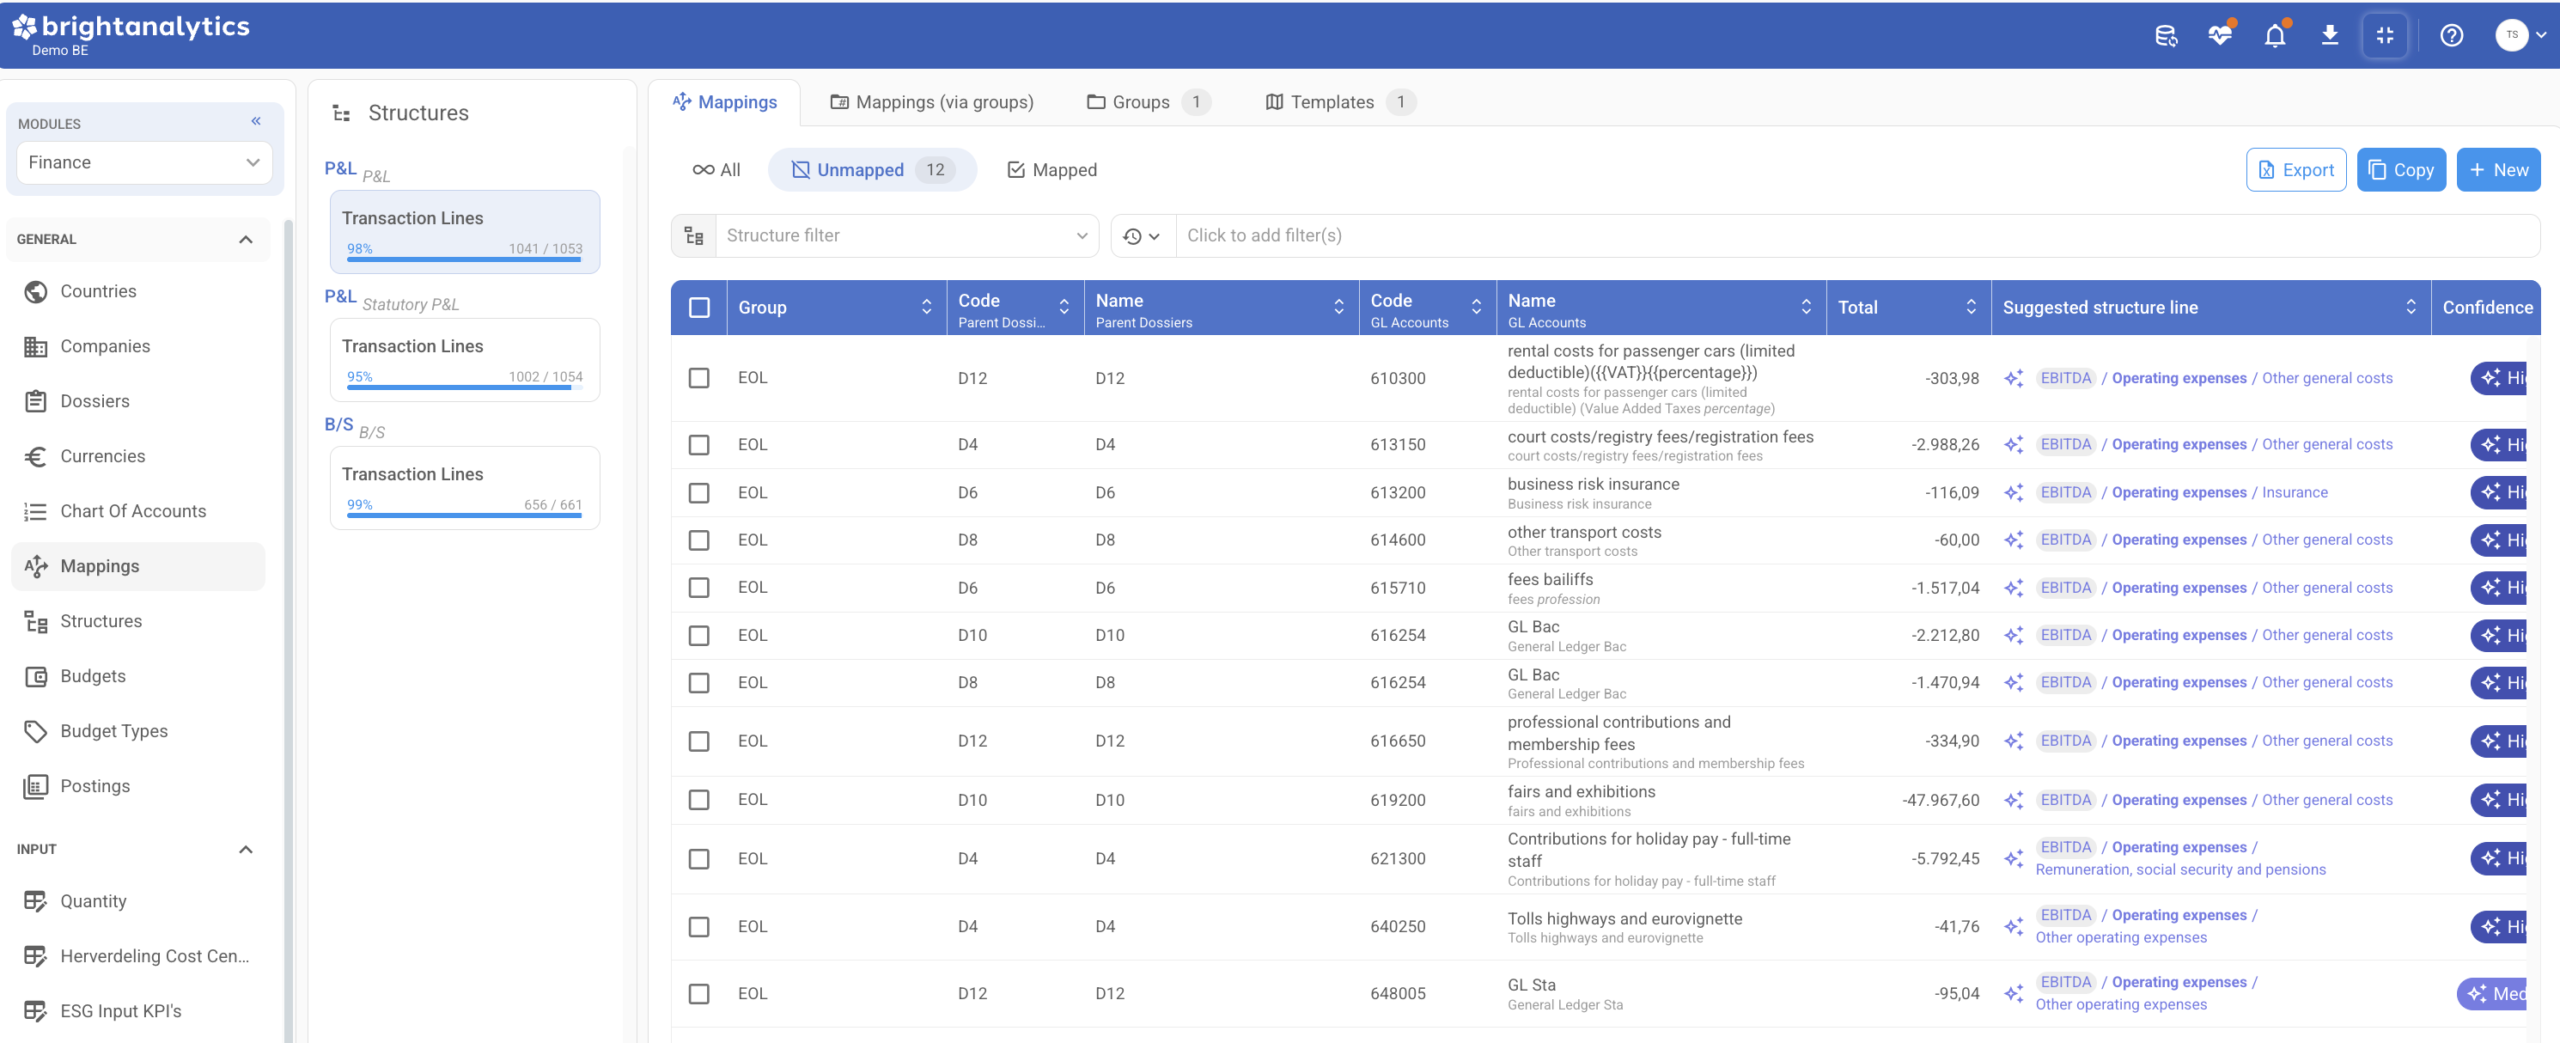
Complex budgeting and planning platforms often take months to stand up, frequently requiring specialized consultants or technical guidance just to handle initial configuration. BrightAnalytics is built differently:
- No specialist required: The tool is designed to be managed directly by finance and operational teams without relying on internal IT or external consultants.
- Full control in your hands: Mappings, reporting structures, dashboards, and user access rights can all be updated directly inside our self-service Admin Panel.
- Rapid connectivity: With 450 ++ pre-built integrations, BrightAnalytics connects to the accounting and ERP systems you already use, so you can start reporting without waiting on custom development.
2. Built as one connected environment

When group reporting systems grow by stitching together independent products, finance teams often end up managing redundant setups and fragmented data flows.
BrightAnalytics connects advanced consolidation, financial reporting, operational analytics, and financial planning & analysis (FP&A) within a single platform. Every feature runs on the same data foundation, making it simple to scale as your group grows. You can expand from core reporting into complex group setups using our Advanced Consolidation app. Handle automated intercompany eliminations without reconfiguring your structure or setting up external connectors.
3. Reporting that flexes with you

While other solutions can rely heavily on spreadsheet-style web forms and Excel-based logic, BrightAnalytics gives you interactive, dynamic dashboards natively in your browser.
- Ready out of the box: Profit and loss statements, balance sheets, and cash flow reports are available immediately without building formulas from scratch.
- Deep data drill-down: Slicing and dicing data happens natively; you can drill straight down to individual transaction postings and original scanned invoices without exporting to external sheets.
- Integrated operational KPIs: Track non-financial metrics (SaaS KPIs, billable hours, project margins, and sales funnels) alongside core financial numbers in one place.
4. Plan, forecast, and follow up in one platform
Budgets built in spreadsheet-style models tend to drift from reality once the books close, and keeping them aligned means constant exports and manual fixes. In BrightAnalytics, budgets, forecasts, and scenarios run on the same live data as your reporting, so you can track performance, model what’s next, and catch problems before they reach the board deck.
- Budgets and rolling forecasts next to your actuals: Build budgets, forecasts, and rolling forecasts directly alongside actuals instead of in static templates. Already have your budget in Excel? Upload it and start tracking performance right away.
- Scenario modeling on live data: Run what-if, base, best, and worst case scenarios and see the impact before you decide.
- Cash forecasting: Combine actuals, budgets, aging data, and loans to predict your future cash position and spot shortfalls while there’s still time to act.
- Controlling beyond the GL: Follow up budget vs. actual by customer, supplier, project, or cost unit, not just by account.
5. Fast, direct integrations for local and global software landscapes
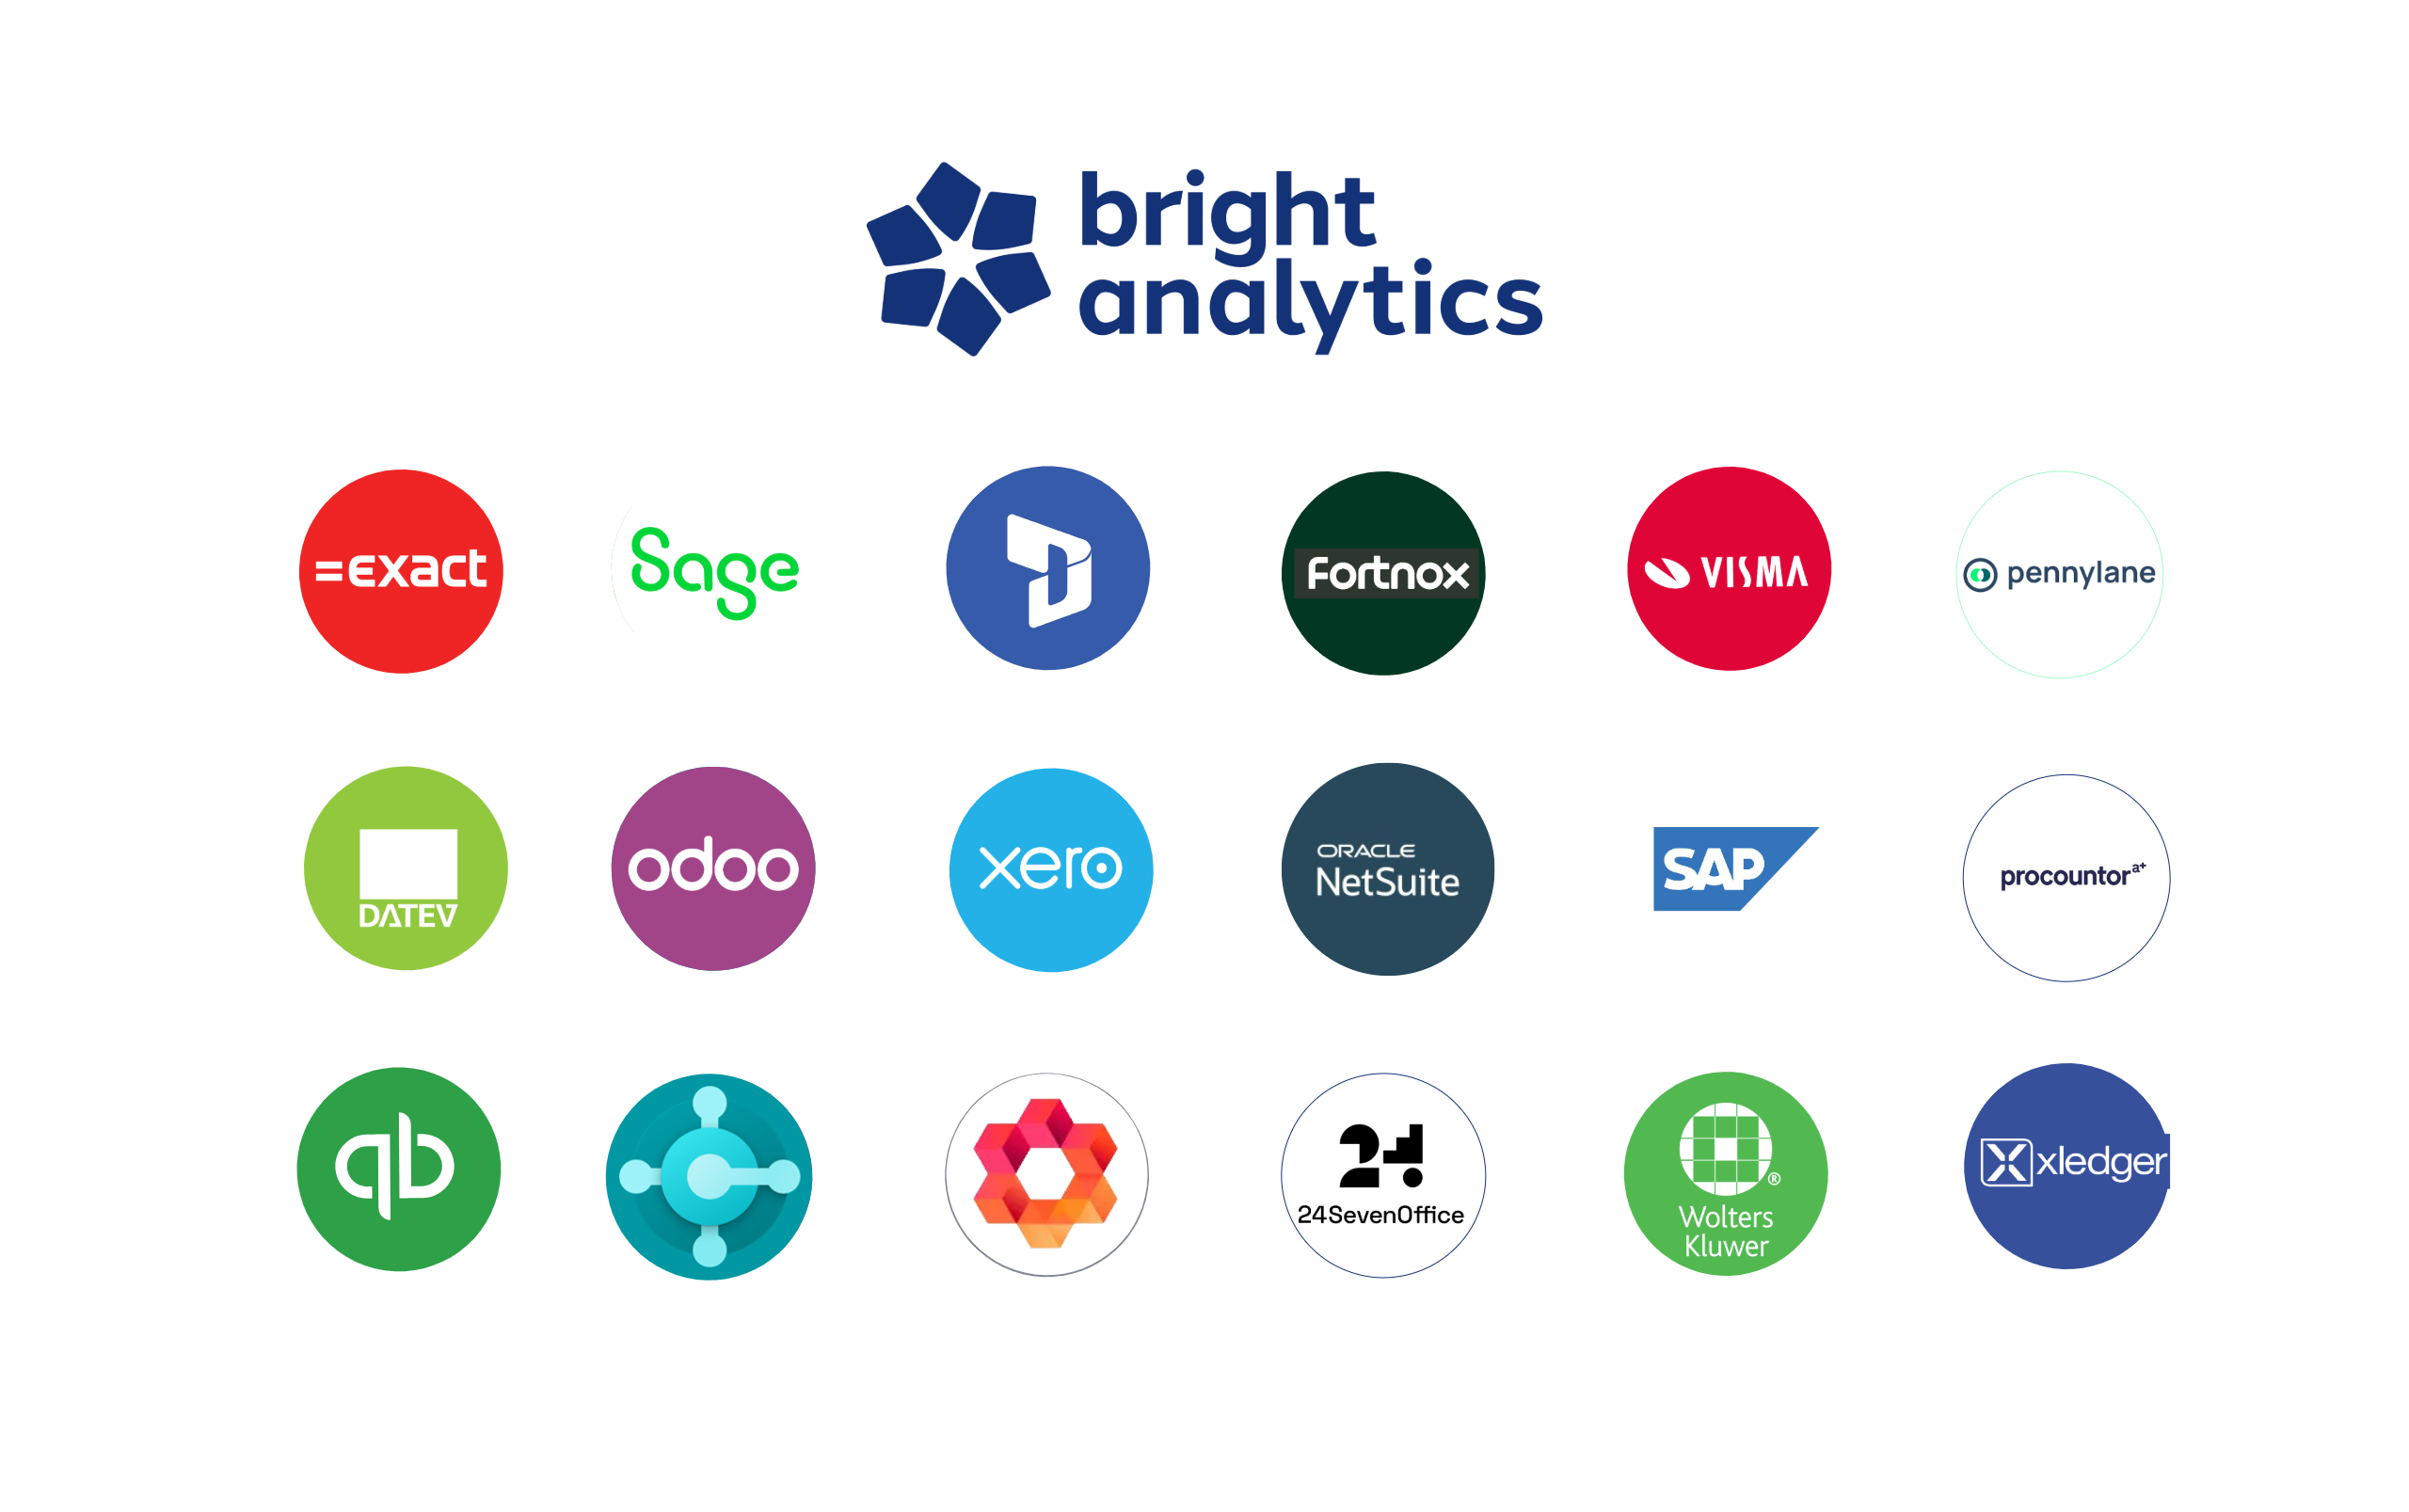
We connect to your cloud or on-premise accounting, ERP, and CRM systems through over 450+ pre-built integrations. That includes popular Nordic systems like Fortnox, Visma, 24SevenOffice, and PowerOffice alongside global tools like SAP, Microsoft Dynamics, Exact, and NetSuite.
If your system isn’t on the list, we typically build new connectors in a matter of days. BrightAnalytics sits as a direct layer on top of your data, so you spend your time analyzing numbers instead of gathering them in spreadsheets.
6. Embedded AI that automates routine finance work

Artificial intelligence is embedded natively throughout BrightAnalytics:
- Instant anomaly detection: An AI controller continuously monitors figures against prior periods to flag unusual cost spikes or deviations before you close the books.
- Smart chart of accounts mapping: Built-in AI automatically suggests general ledger account mappings when onboarding new entities and learns from your approvals over time.
- AI-assisted reconciliation: Cuts down manual intercompany matching by surfacing discrepancies instantly.
Why companies choose BrightAnalytics
1. Fast to get running, without a heavy implementation project
Complex budgeting and planning platforms often take months to stand up, frequently requiring specialized consultants or technical guidance just to handle initial configuration. BrightAnalytics is built differently:
- No specialist required: The tool is designed to be managed directly by finance and operational teams without relying on internal IT or external consultants.
- Full control in your hands: Mappings, reporting structures, dashboards, and user access rights can all be updated directly inside our self-service Admin Panel.
- Rapid connectivity: With 450 ++ pre-built integrations, BrightAnalytics connects to the accounting and ERP systems you already use, so you can start reporting without waiting on custom development.
2. Built as one connected environment
When group reporting systems grow by stitching together independent products, finance teams often end up managing redundant setups and fragmented data flows.
BrightAnalytics connects advanced consolidation, financial reporting, operational analytics, and financial planning & analysis (FP&A) within a single platform. Every feature runs on the same data foundation, making it simple to scale as your group grows. You can expand from core reporting into complex group setups using our Advanced Consolidation app. Handle automated intercompany eliminations without reconfiguring your structure or setting up external connectors.
3. Reporting that flexes with you
While other solutions can rely heavily on spreadsheet-style web forms and Excel-based logic, BrightAnalytics gives you interactive, dynamic dashboards natively in your browser.
- Ready out of the box: Profit and loss statements, balance sheets, and cash flow reports are available immediately without building formulas from scratch.
- Deep data drill-down: Slicing and dicing data happens natively; you can drill straight down to individual transaction postings and original scanned invoices without exporting to external sheets.
- Integrated operational KPIs: Track non-financial metrics (SaaS KPIs, billable hours, project margins, and sales funnels) alongside core financial numbers in one place.
4. Plan, forecast, and follow up in one platform
Budgets built in spreadsheet-style models tend to drift from reality once the books close, and keeping them aligned means constant exports and manual fixes. In BrightAnalytics, budgets, forecasts, and scenarios run on the same live data as your reporting, so you can track performance, model what’s next, and catch problems before they reach the board deck.
- Budgets and rolling forecasts next to your actuals: Build budgets, forecasts, and rolling forecasts directly alongside actuals instead of in static templates. Already have your budget in Excel? Upload it and start tracking performance right away.
- Scenario modeling on live data: Run what-if, base, best, and worst case scenarios and see the impact before you decide.
- Cash forecasting: Combine actuals, budgets, aging data, and loans to predict your future cash position and spot shortfalls while there’s still time to act.
- Controlling beyond the GL: Follow up budget vs. actual by customer, supplier, project, or cost unit, not just by account.
5. Fast, direct integrations for local and global software landscapes
We connect to your cloud or on-premise accounting, ERP, and CRM systems through over 450+ pre-built integrations. That includes popular Nordic systems like Fortnox, Visma, 24SevenOffice, and PowerOffice alongside global tools like SAP, Microsoft Dynamics, Exact, and NetSuite.
If your system isn’t on the list, we typically build new connectors in a matter of days. BrightAnalytics sits as a direct layer on top of your data, so you spend your time analyzing numbers instead of gathering them in spreadsheets.
6. Embedded AI that automates routine finance work
Artificial intelligence is embedded natively throughout BrightAnalytics:
- Instant anomaly detection: An AI controller continuously monitors figures against prior periods to flag unusual cost spikes or deviations before you close the books.
- Smart chart of accounts mapping: Built-in AI automatically suggests general ledger account mappings when onboarding new entities and learns from your approvals over time.
- AI-assisted reconciliation: Cuts down manual intercompany matching by surfacing discrepancies instantly.
- What is BrightAnalytics?
BrightAnalytics is the most intuitive, reliable and fast management reporting platform that covers all needs on management reporting and consolidation.
- Who is BrightAnalytics?
BrightAnalytics is a growing technology company. Our goal is to help companies streamline their management reporting processes.
- How does BrightAnalytics work?
- Connect: BrightAnalytics connects with accounting, ERP and CRM systems, and centralises all data in the BrightAnalytics platform.
- Report: The standard templates in BrightAnalytics are immediately ready for use, but can be fully tailored to suit one’s needs.
- Analyse: The management reports and dashboards offer a wealth of information and immediately provide clear insight into the figures of the entire organisation.
- Engage: The clear reports contribute to a better streamlined business strategy and execution, and ensure transparency within the company.
- How do I connect BrightAnalytics to my package?
With our BrightSync we connect to more than 400 data sources. One of the biggest USP’s of the solution is our possibility to connect with every system.