5 tips why retailers need a dashboard
Retailers can make better decisions, reduce costs and increase profitability by using BrightAnalytics.
Get better insights into your company’s financial and operational data
Retailers and companies with a retail-based business structure can make better decisions, reduce costs, and increase profitability using BrightAnalytics. The platform is especially useful for tracking indirect costs like overhead or accommodation per branch, business unit, or region—and seeing how these costs affect profitability.
1. Access Real-Time Data
Imagine a retail chain with branches in different locations. Rents and utility costs vary per branch and increase annually. If management and branch managers don’t adjust activities according to these costs, the company’s bottom line can suffer.
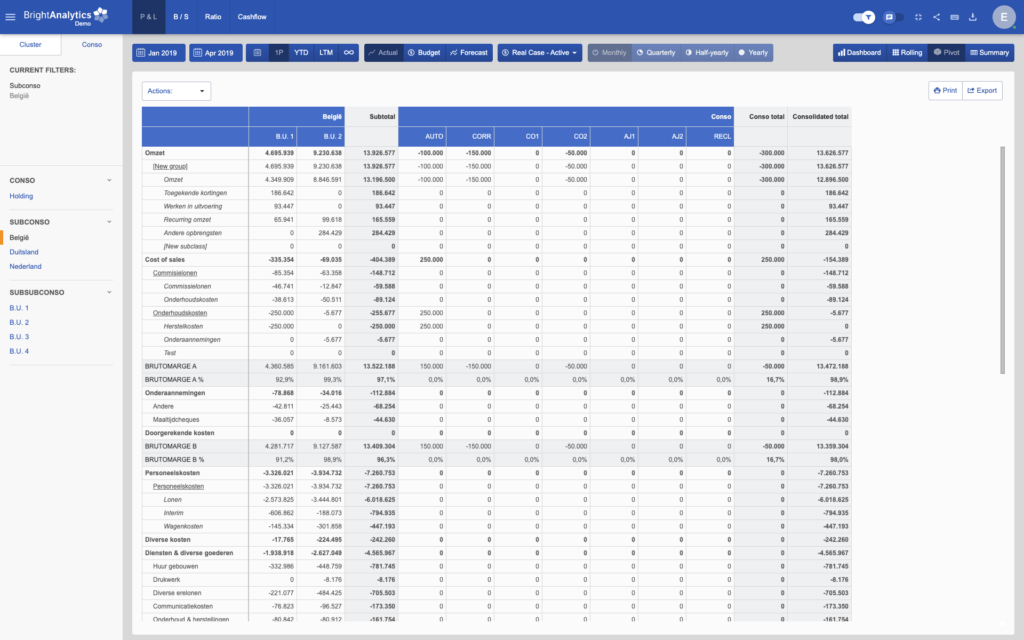
A dashboard lets management quickly see how overhead, housing, personnel, and other costs change relative to turnover. Real-time data shows cause and effect immediately, helping decision-makers act fast in a changing economic landscape.
2. Keep the Budget Under Control
Dashboards make it easy to monitor budgets. “What-if” scenarios allow you to compare actual figures with budgeted projections. This gives a clear picture of deviations and helps you stay on track.
3. Understand the Details
Dashboards detect trends in costs and revenue across branches, regions, or departments. Drill-down capabilities let you uncover the causes of profitability loss and provide insights into even the smallest details.
4. Engage Employees
Traditionally, reports and KPIs were sent from the head office to branches weekly or monthly.
Now, “self-service” reporting allows managers and employees to access dashboards directly. Making numbers transparent increases engagement and encourages staff to improve their own performance.
5. Make Smarter Decisions
Interactive dashboards let managers test different scenarios:
What happens if staff costs change?
What if a new store opens?
What if prices are adjusted?
These insights help managers plan smarter, avoid surprises, and make better strategic decisions.
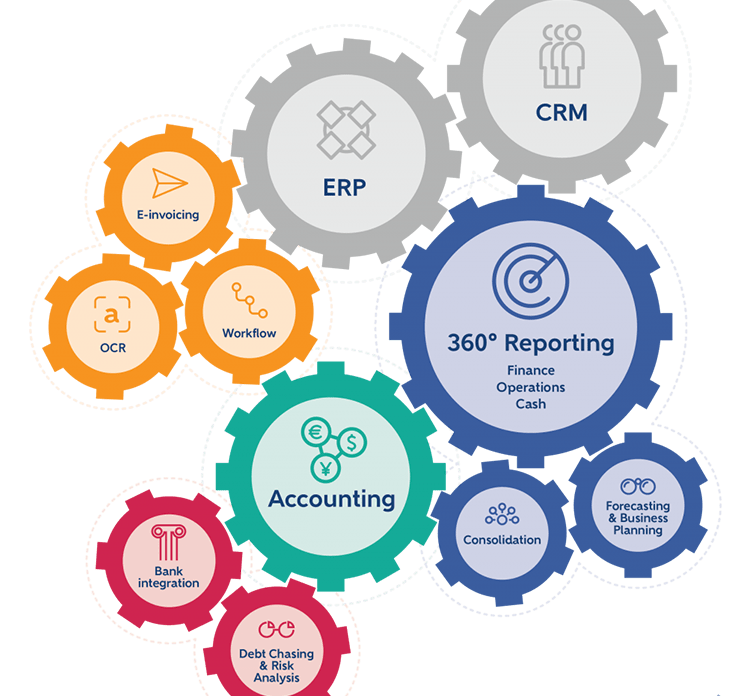
BrightAnalytics centralizes all your financial and operational data. The powerful and clear dashboards provide instant insight into the state of your business and put your operational data in context. Compare performances, build as many top 10’s as you like, or spot risks and anticipate trends in time.
BrightAnalytics offers a 360° overview of your organisation and allows you to make efficient, well-founded strategic decisions.
Would you like to know more about our solution? Sign up for one of our webinars or a demo.