
BrightAnalytics: an Oxceed alternative for financial consolidation and reporting
Looking for an Oxceed alternative? BrightAnalytics is a consolidated management reporting platform built for growing multi-entity groups, connected directly to your source systems so your numbers stay accurate and current.
Why companies choose BrightAnalytics
1. Self-service, without a specialist on standby
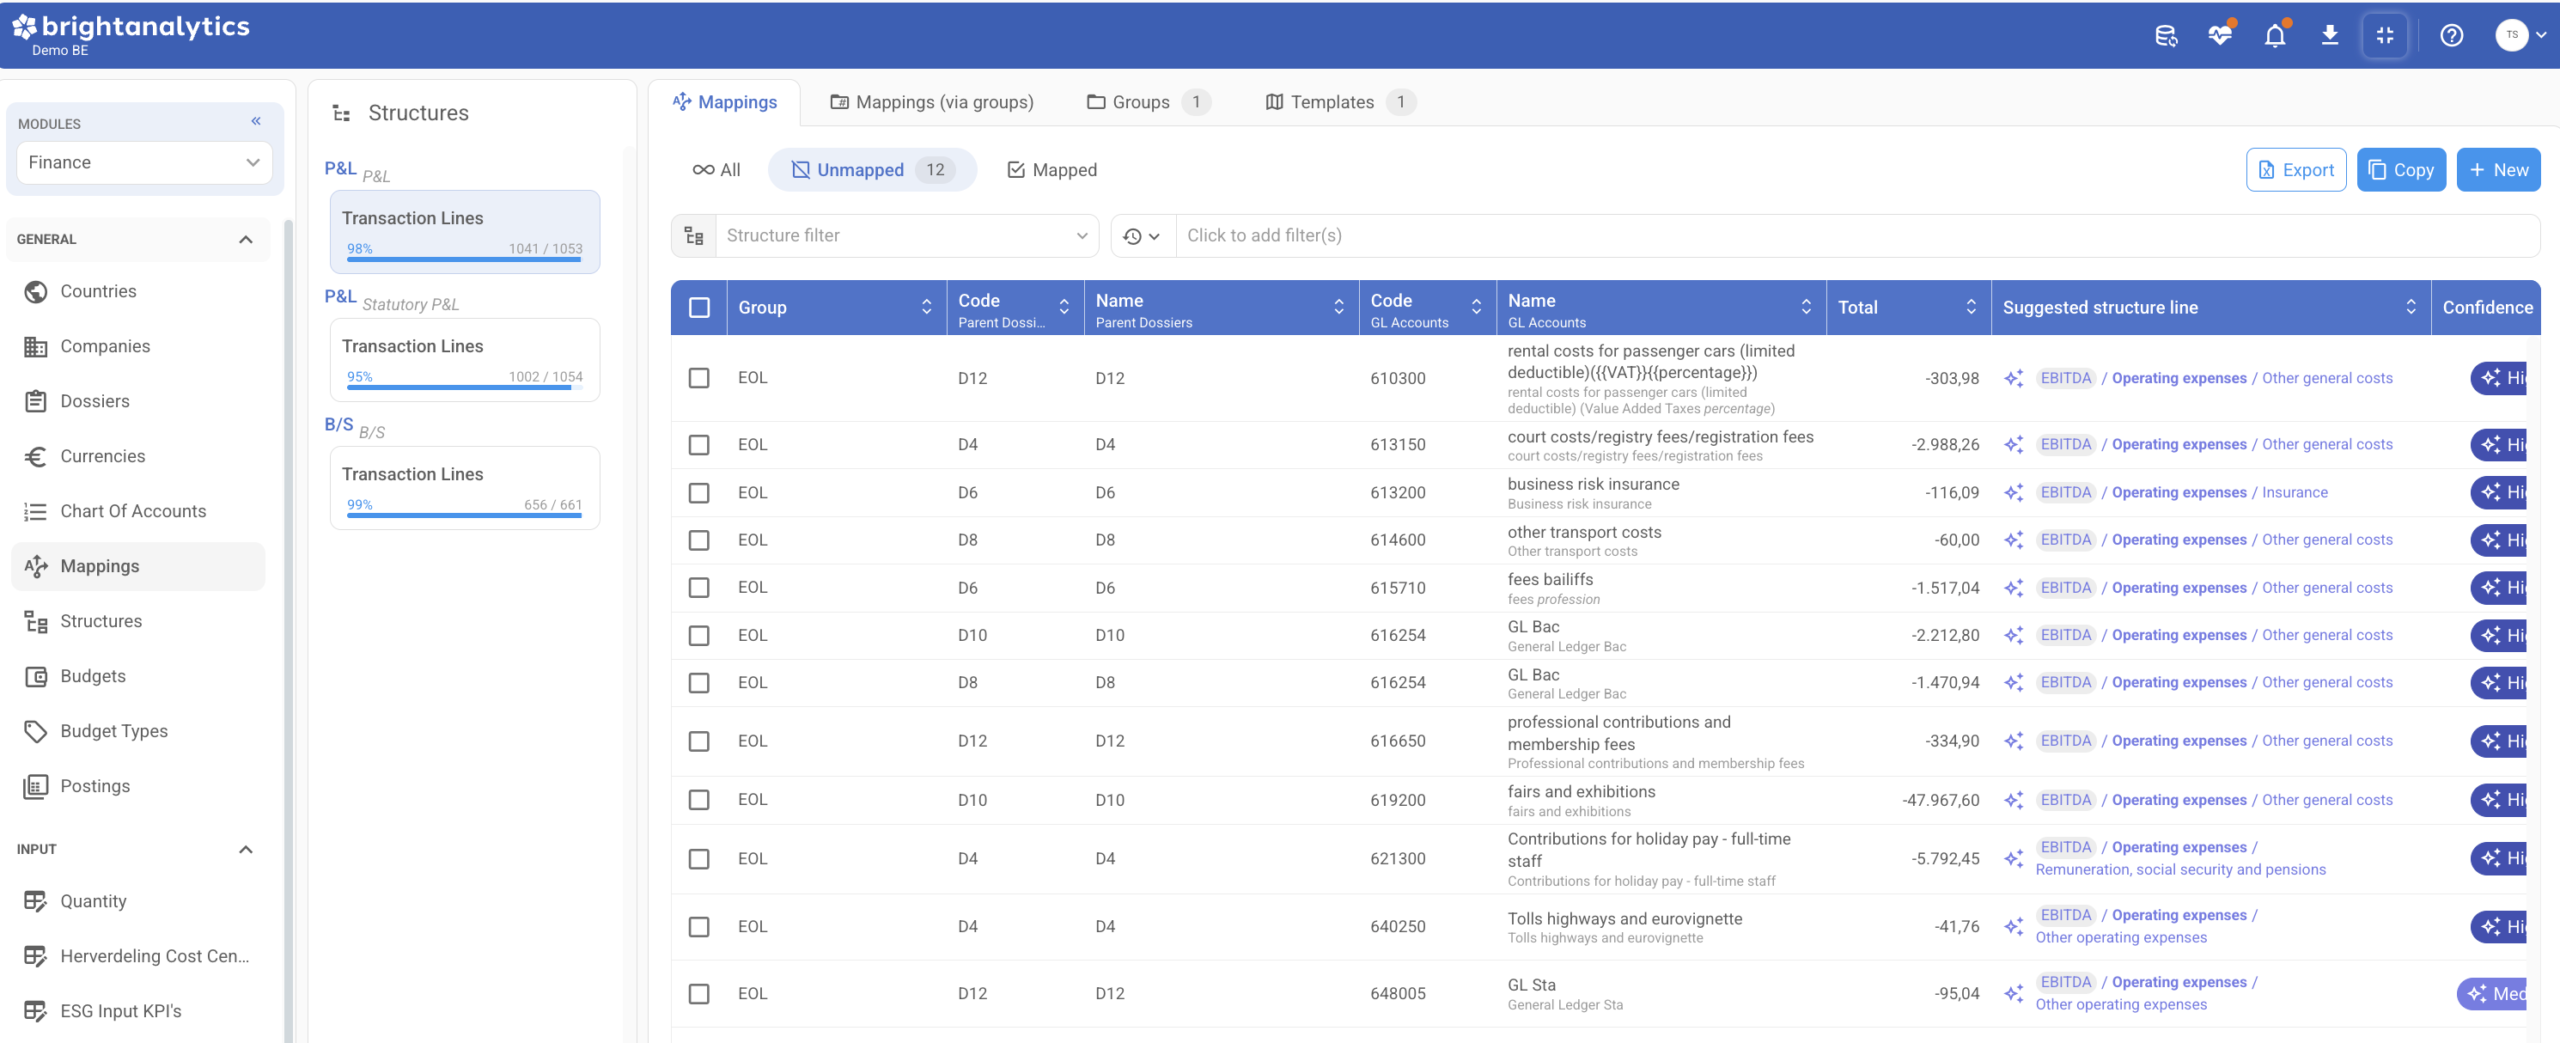
BrightAnalytics puts full control in the hands of your internal finance team. Through our self-service admin panel, you can modify reporting structures, update general ledger mappings, adjust cost center filters, and manage user access rights directly without technical support.
2. Consolidation for two entities or twenty
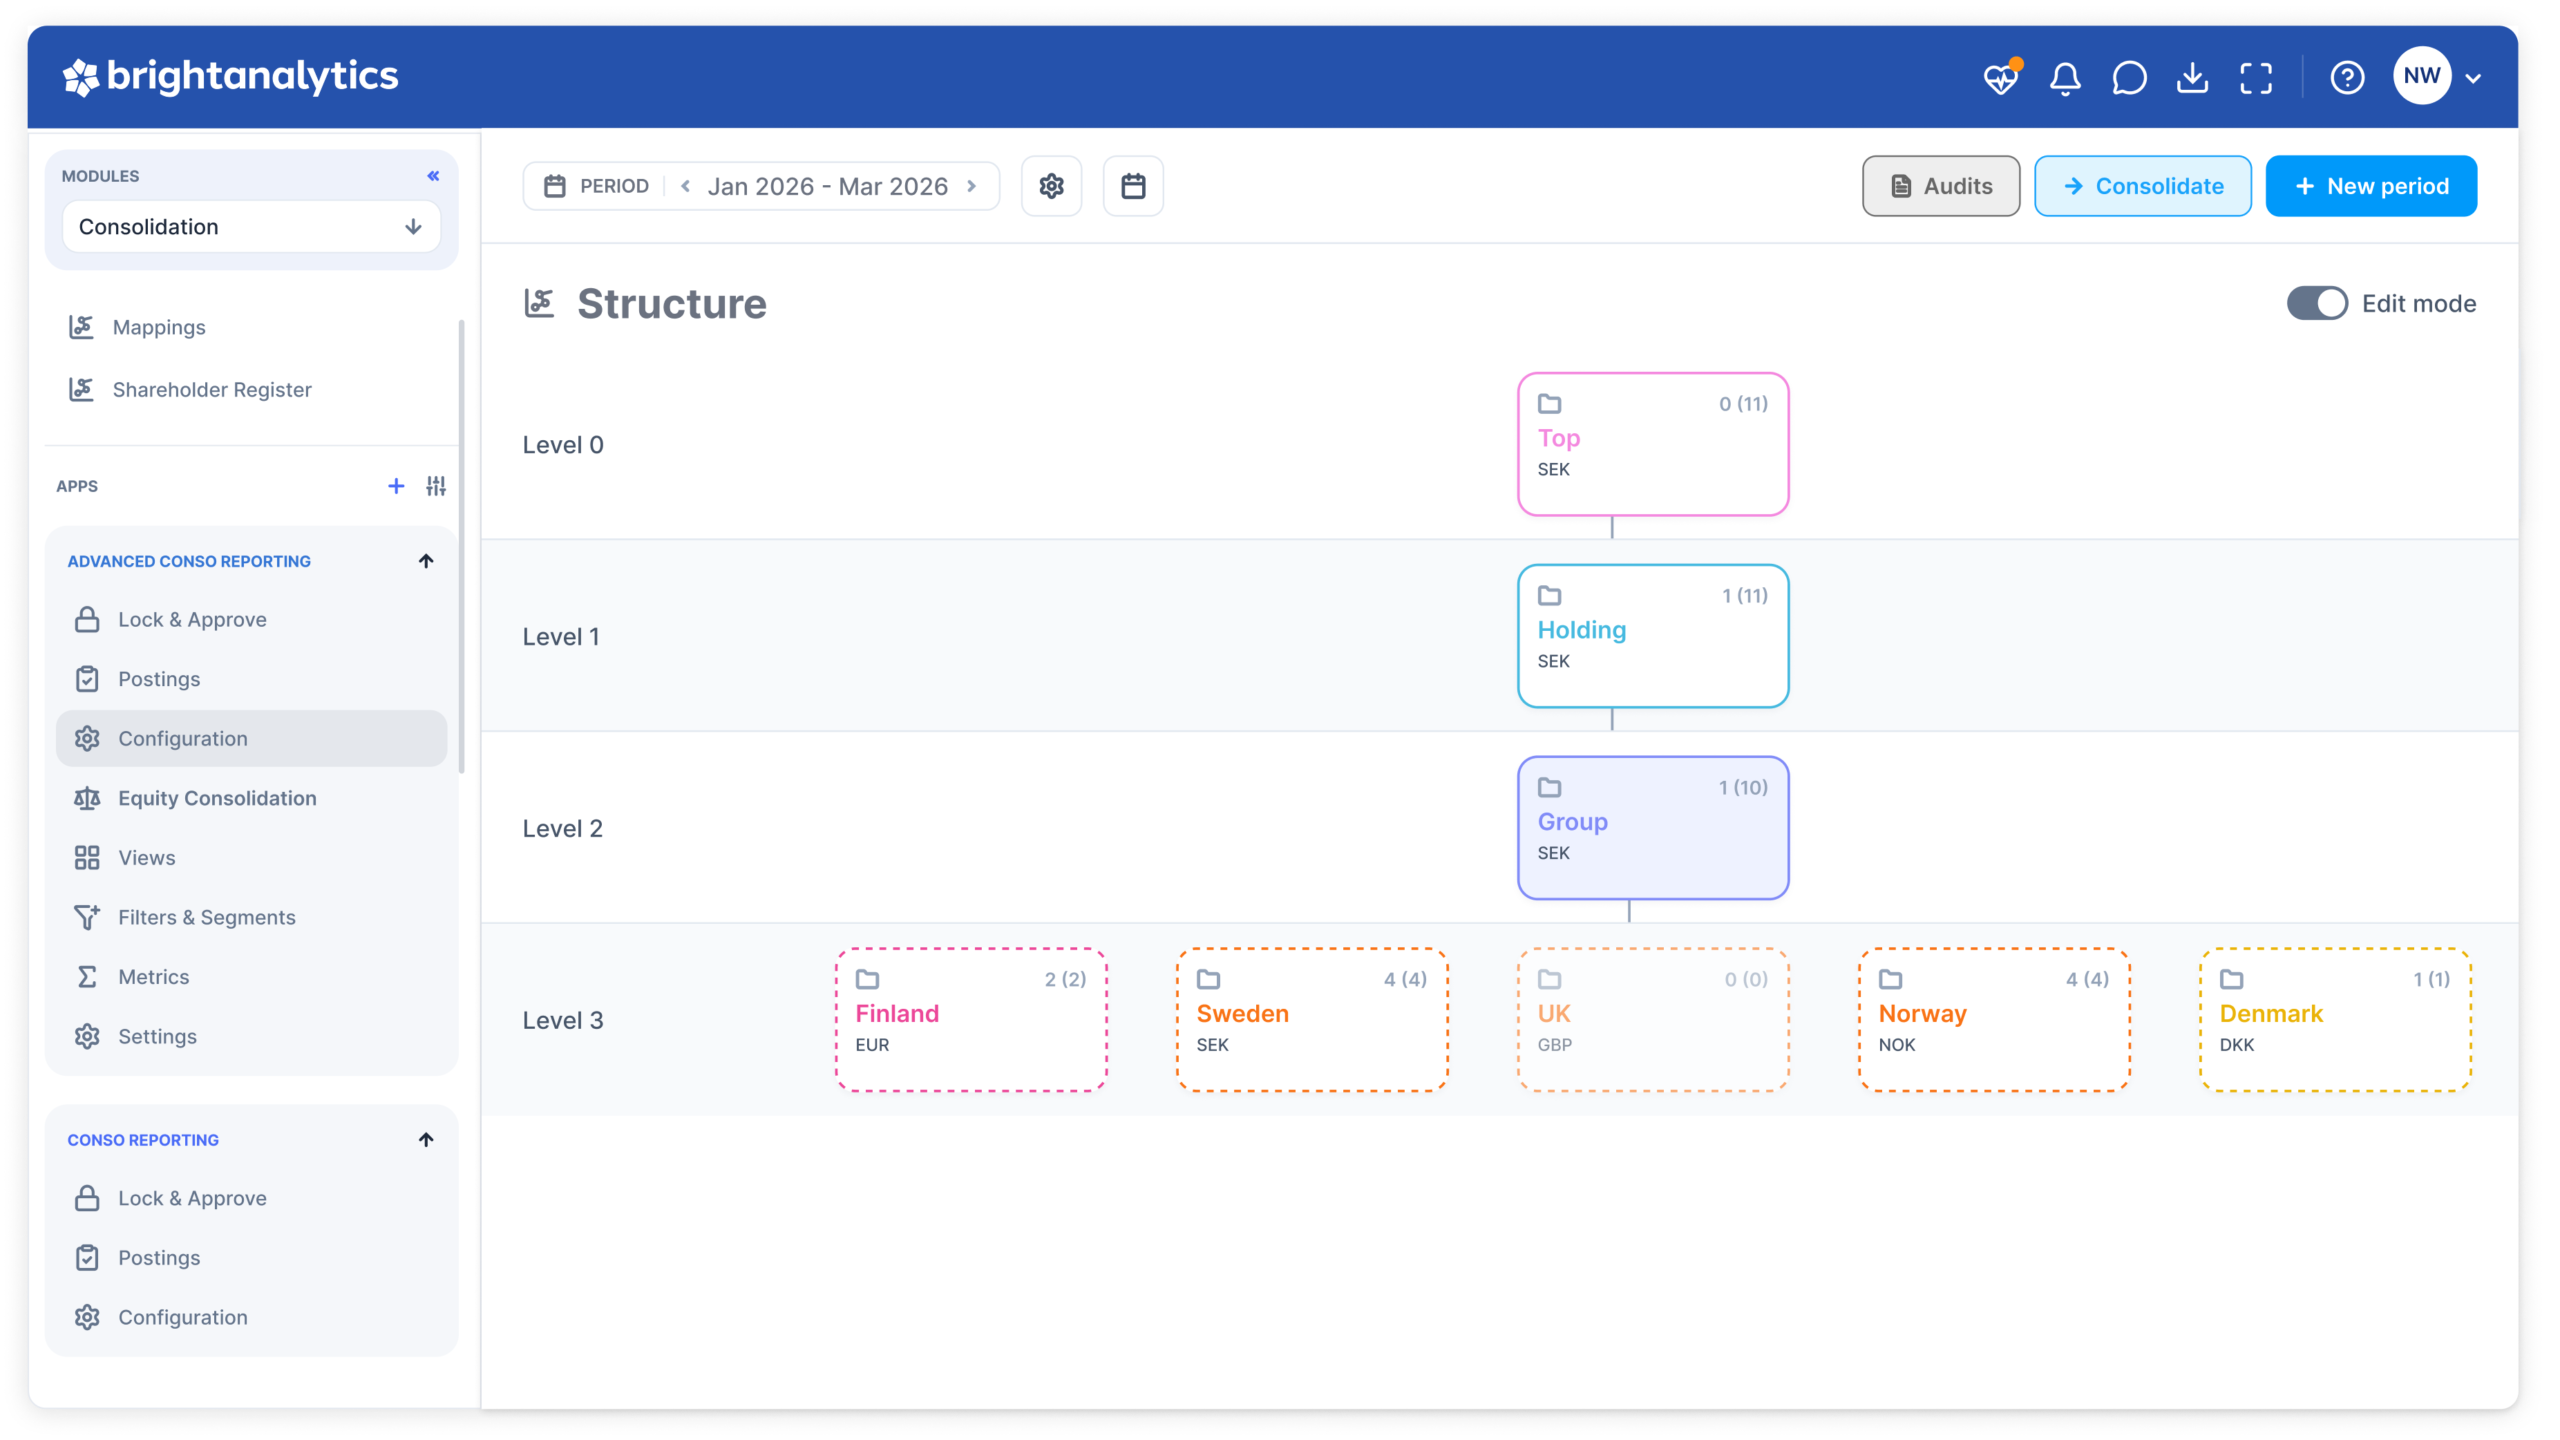
Whether you’re consolidating a parent company and one subsidiary or a group with entities in several countries, BrightAnalytics brings everything together in one consolidated view. Start with what you need today and add more as your structure grows, without changing tools or rebuilding your setup.
- Intercompany found for you: AI reads your entities’ transactions and flags what’s intercompany, with no tagging needed in your source systems.
- Mismatches at a glance: Every intercompany relationship shows up as a tile on the Smart Map. Green means both sides agree. If a tile isn’t green, drill down to the difference and approve the bookings the AI suggests to close it.
- Different currencies and financial years: Entities with their own currencies, accounting packages, or financial years fit into the same consolidation.
- Ready when your structure gets complex: Sub-consolidation groups, ownership percentages, and, with the Advanced Consolidation app, equity consolidation and minority interests.
3. Reporting across financial and operational numbers
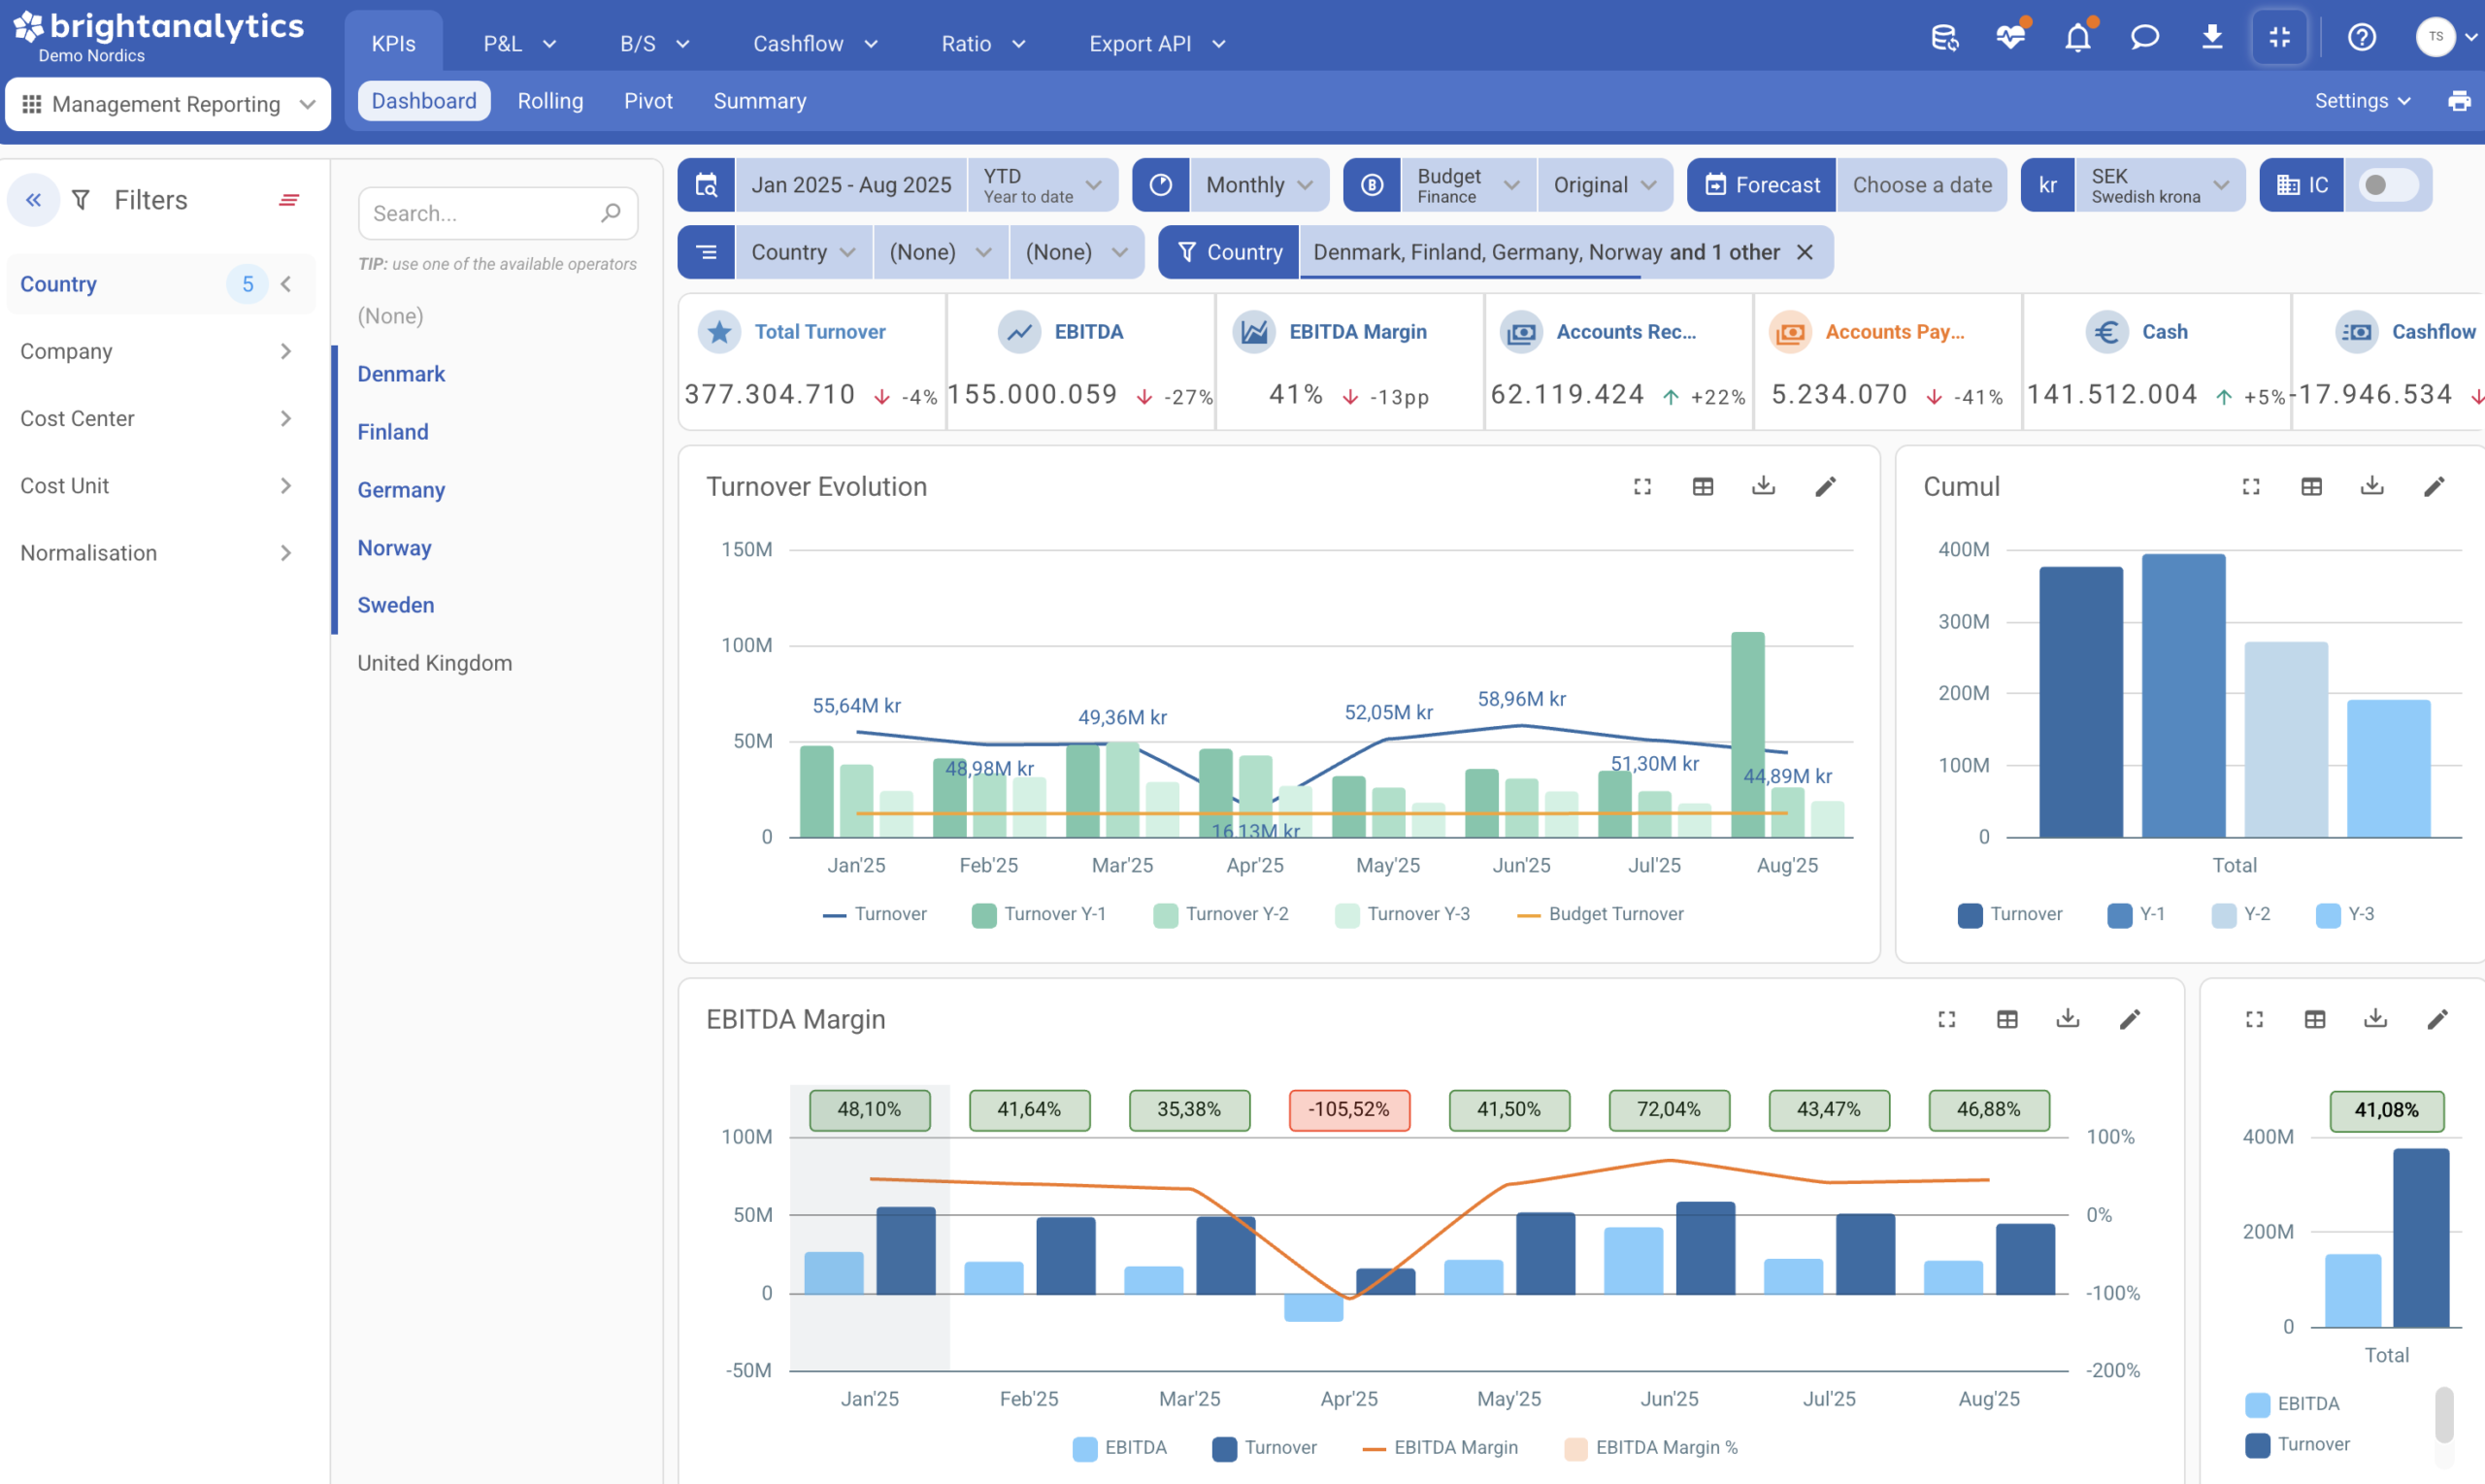
Many smaller reporting tools are built around one source: your accounting system. That covers the financial statements well, but the numbers that explain them, like your sales pipeline, billable hours, or subscription revenue, often live somewhere else. BrightAnalytics brings financial and operational data together on one platform, so you can see how each entity and business unit is really performing, not just what was booked.
- Finance logic built in: Financial statements come ready to use, structured the way finance teams read them.
- Every angle on the same numbers: View figures by cost center, department, project, or business line, at entity or group level.
- Operational apps alongside the financials: Track KPIs like SaaS metrics, billability, project margins, and sales funnels next to your actuals.
- Drill down to the source: Go from any figure to the general ledger postings and original scanned invoices behind it.
4. Direct API integrations for international landscapes
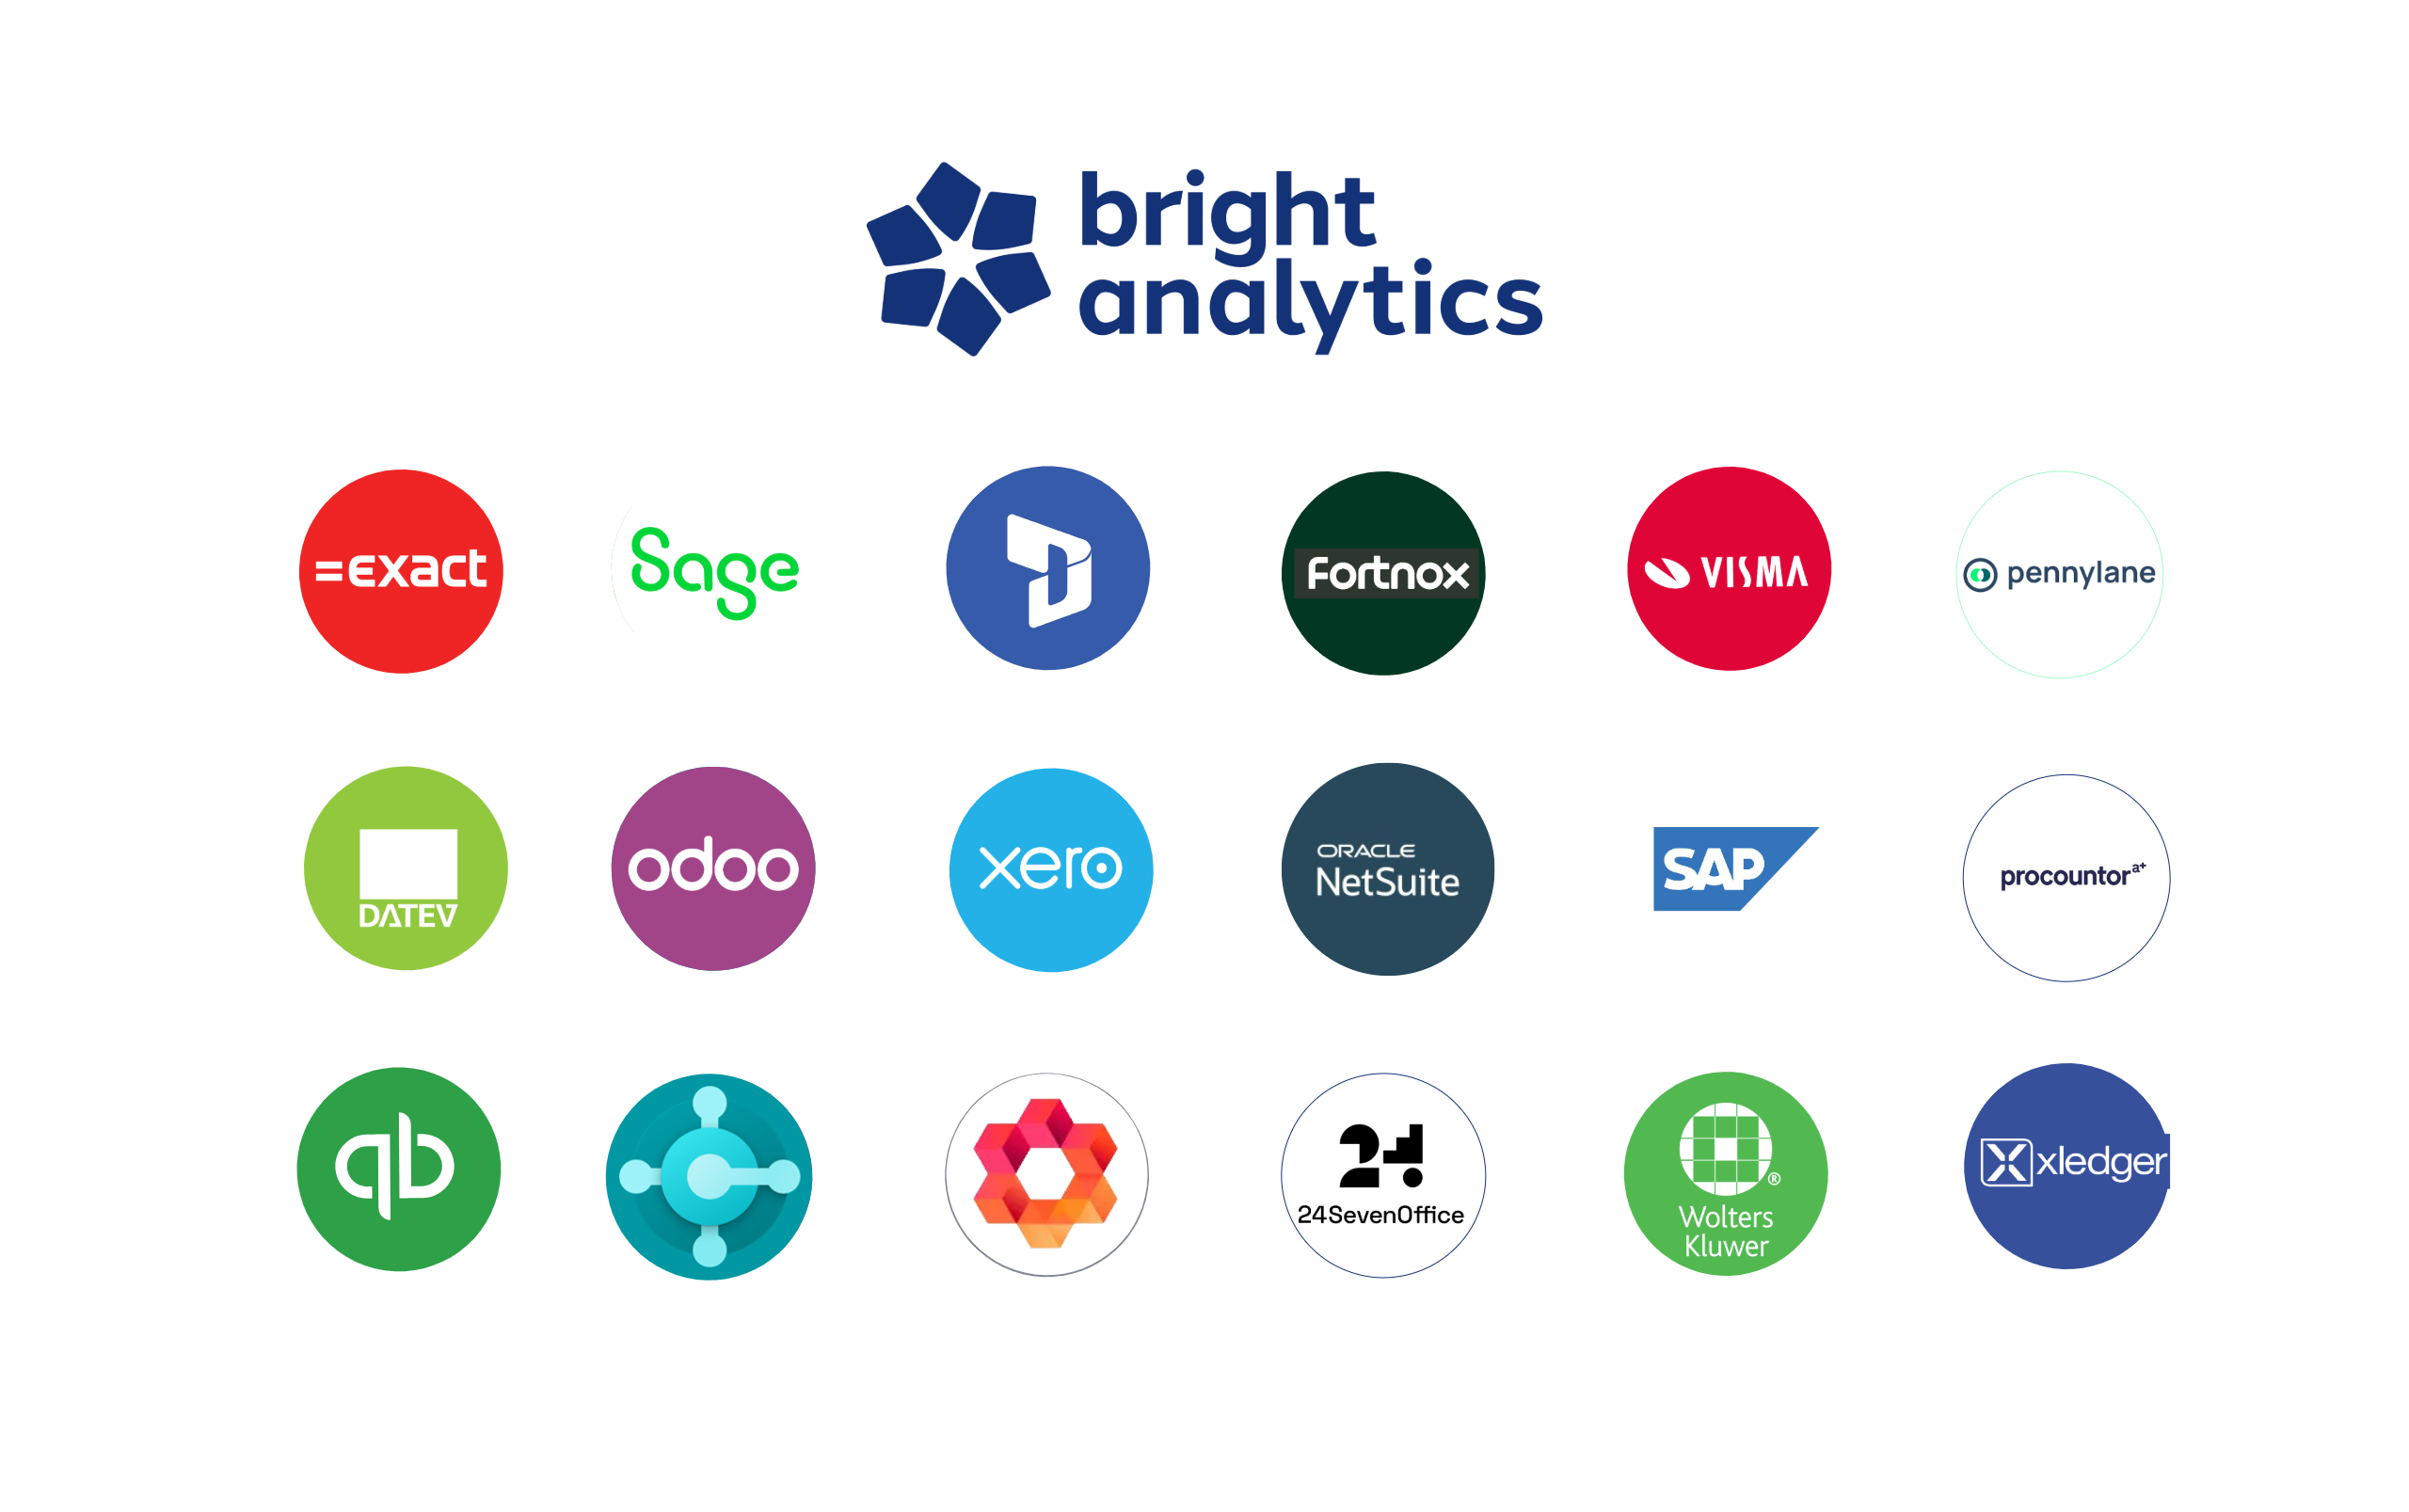
Basic reporting packages connect to standard local tools, but frequently rely on manual SIE file uploads for foreign subsidiaries. BrightAnalytics connects to cloud or on-premise accounting, ERP, and CRM systems through over 450+ pre-built API integrations. This includes popular Swedish and Nordic platforms like Fortnox, Visma, 24SevenOffice, Björn Lundén, Hogia, and PowerOffice alongside global enterprise systems like Microsoft Dynamics, SAP, Exact, Sage, and NetSuite.
Data syncs automatically overnight or on-demand, giving international groups live, direct access to foreign entity data without manual spreadsheet workarounds. If a system isn’t on our pre-built list, we typically build new connectors in a matter of days.
5. AI that takes routine work off your plate

A lot of closing time goes to checking, matching, and mapping. BrightAnalytics uses AI to handle the routine parts, so you can focus on what the numbers mean.
- Anomaly detection: An AI controller scans your figures against prior periods and flags unexpected cost spikes or deviations before you close.
- Chart of accounts mapping: When you onboard a new entity, built-in AI suggests general ledger mappings and learns from what you approve.
- Your data stays yours: Our AI runs on internal infrastructure, so your numbers never go to a third party.

Ready to see how it works for your business?
Closing periods and board prep don’t have to mean long hours, manual file uploads, or waiting on specialists for report changes. Book a demo to see how BrightAnalytics fits into your setup.
- What is BrightAnalytics?
BrightAnalytics is the most intuitive, reliable and fast management reporting platform that covers all needs on management reporting and consolidation.
- Which reporting modules does BrightAnalytics offer?
BrightAnalytics, the management reporting platform, offers 3 different reporting modules. The basic module covers financial reporting, and can be extended with the cash and/or operational reporting modules.
- How does BrightAnalytics work?
- Connect: BrightAnalytics connects with accounting, ERP and CRM systems, and centralises all data in the BrightAnalytics platform.
- Report: The standard templates in BrightAnalytics are immediately ready for use, but can be fully tailored to suit one’s needs.
- Analyse: The management reports and dashboards offer a wealth of information and immediately provide clear insight into the figures of the entire organisation.
- Engage: The clear reports contribute to a better streamlined business strategy and execution, and ensure transparency within the company.
- Who is BrightAnalytics?
BrightAnalytics is a growing technology company. Our goal is to help companies streamline their management reporting processes.