Controlling Accounts
The Controlling application delivers profound insights into your financial data, offering the flexibility to deeply understand the evolution of your customer and supplier relationships through highly detailed analysis. This specialisation directly leads to better-informed decision-making and more strategic business planning. For immediate usability, settings such as periodicity or multi-currency are automatically carried over from your Finance application, with the primary focus on areas such as Customers/Suppliers, Accounts P&L, …
Customer and Supplier Depth
Gain significant, data-driven insights into the performance of your customers and suppliers. Our advanced visualisations provide a strategic display of your customers’ geographic distribution, along with the associated cost and revenue dynamics in key regions. This gives you essential insights into potential growth regions and market saturation.
Strategic P&L and market command
The Accounts P&L Module is the crucial upgrade your P&L needs. It replaces the drill-down to GL accounts with a direct link to your customers or suppliers. This means you instantly see the figures that matter, making profitability analysis faster and more reliable than ever before. With a layout focused purely on business entities, you can quickly compare performance across periods and build reliable forecasts tied directly to your key relationships, driving sharper strategic decisions.
Controlling
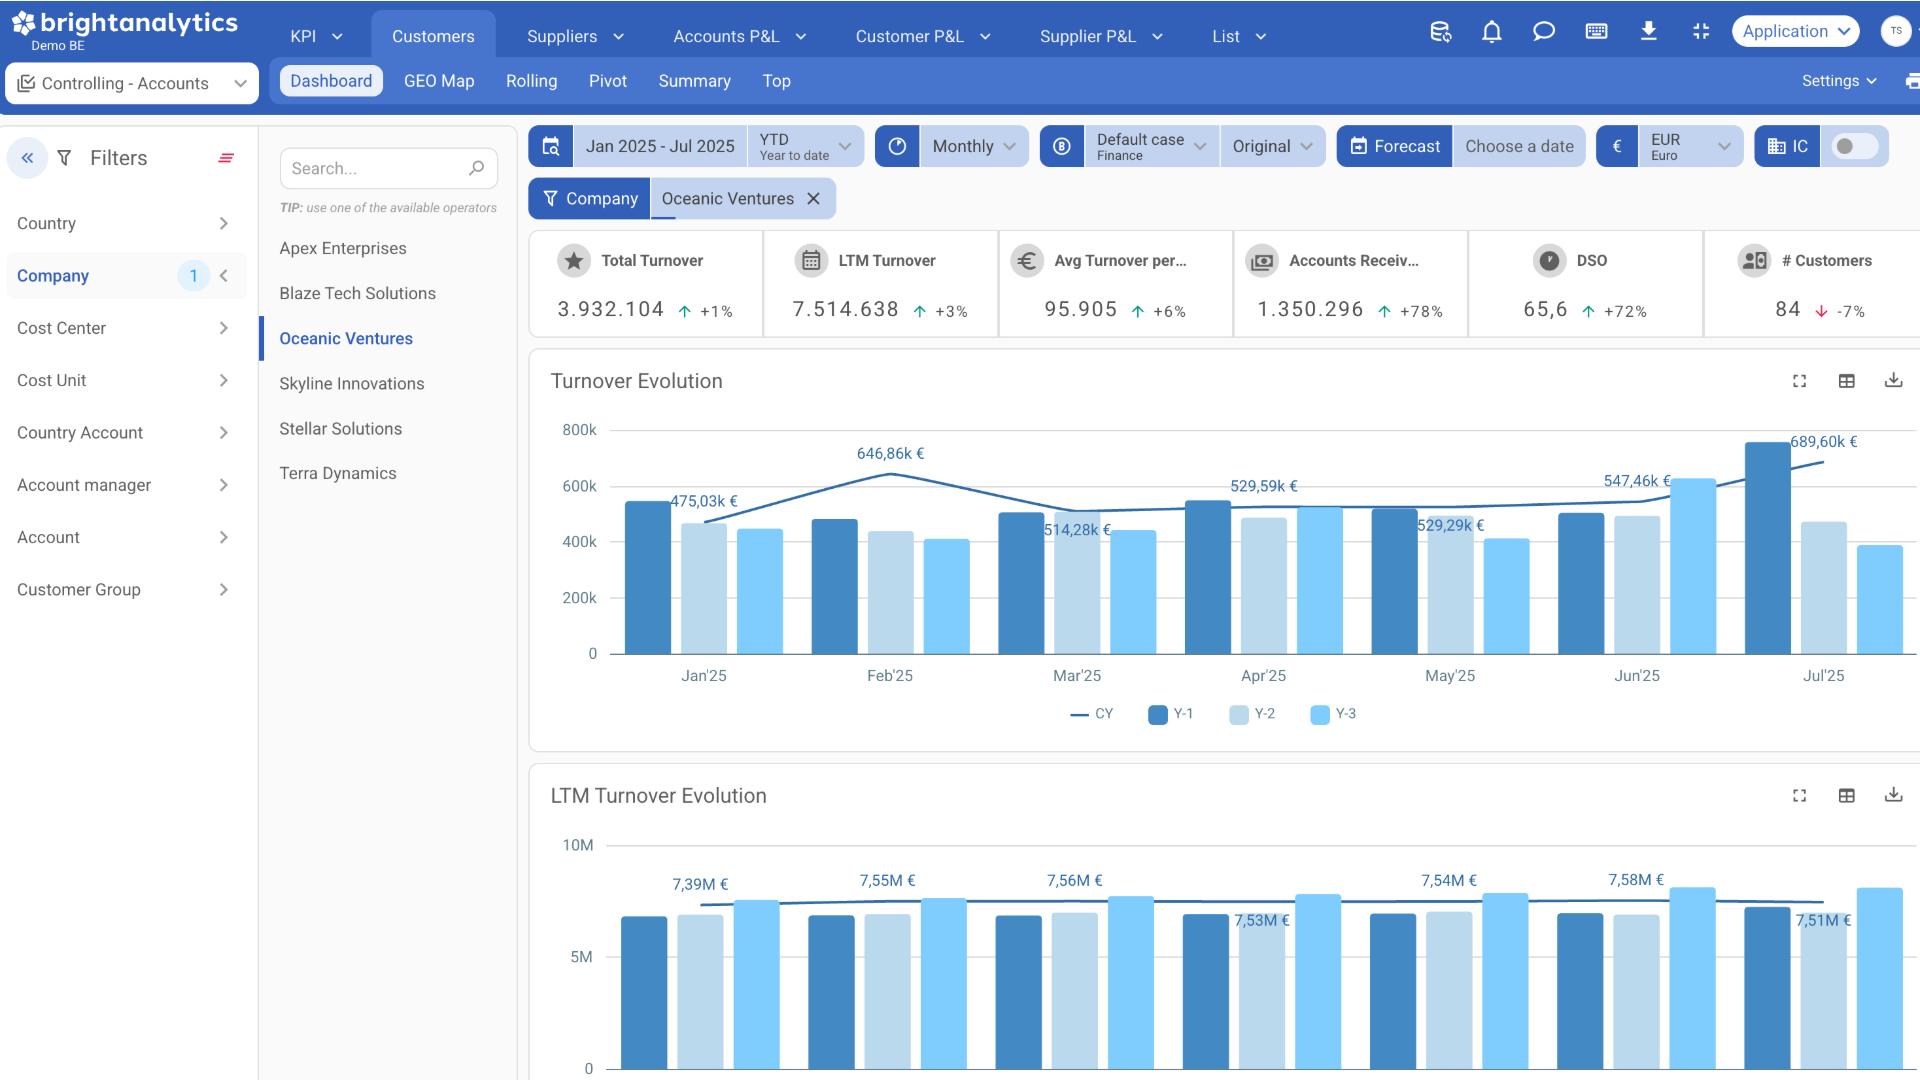
KPI’s
Measure your performance with KPI’s like:
- DSO (Days Sales Outstanding)
- DPO (Days Payables Outstanding)
- # Customers
- Average Turnover Per Customer
- LTM/YTD/Monthly/Total Turnover/Costs
- Top Suppliers/Customers
- …
Filtering Options
The app provides flexible filters for company, project, cost unit and more. It also allows filtering on company-specific dimensions to reveal where results are coming from
Full Dimension Insights
Gain a complete understanding of costs, revenue and margins across all your unique company dimensions. Spot opportunities and trends without overloading your main reports.
Real Time Performance Tracking
Monitor your most important performance metrics as they happen. See trends early, identify areas that need attention and act before small issues become big problems.
Geo map
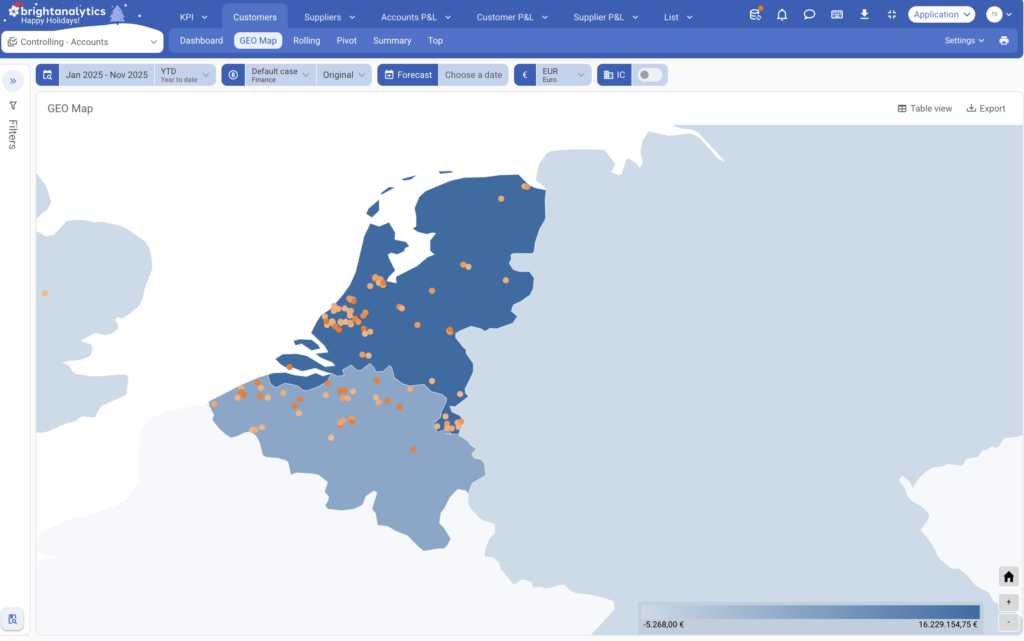
Monitor revenue
Understand how your revenue is generated: discover which account managers generate these, identify your key customers, and use the geo-map to see where these are generated.
Tailored Profit Analysis
Analyze profit and loss for specific projects, departments or product groups. See exactly how each part of your business contributes to overall performance.
Costs linked to document numbers
For significant costs, you can also specifically trace back which invoice, purchase order, … is linked to them.

Let your data speak. BrightAnalytics has more than 400 integrations.
- Connect all types of applications, including accounting, ERP, and CRM.
- The source can be online, on-premise, or even a spreadsheet.
- Any number of applications can be combined on the platform.
FAQ
Below you’ll find answers to commonly asked questions about our controlling app. If you have a question that isn’t addressed here, feel free to reach out to us directly for assistance.
- What is BrightAnalytics?
BrightAnalytics is the most intuitive, reliable and fast management reporting platform that covers all needs on management reporting and consolidation.
- What is the controlling app?
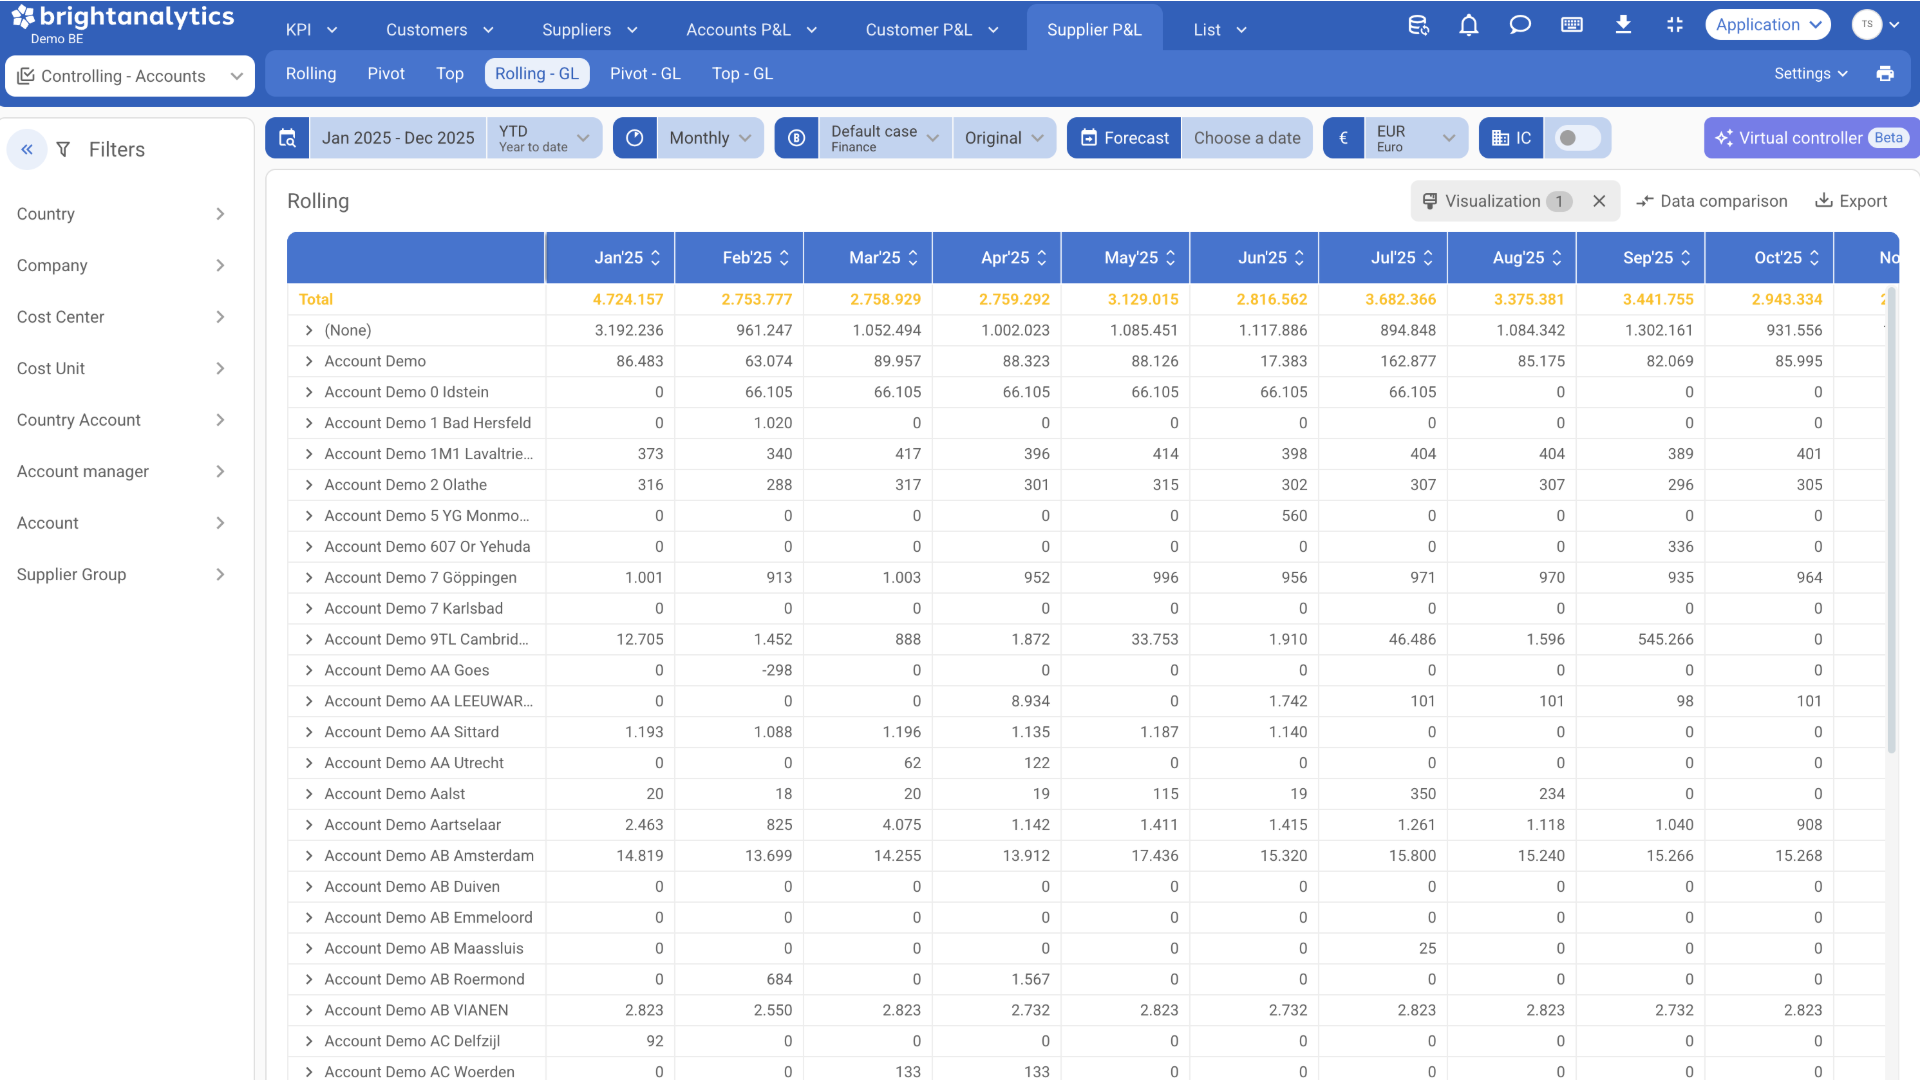
Controlling is an extra finance app, based on the financial data. It dives deeper into the costs and turnover data and reports across dimensions like customer/supplier (groups), location, … The dimensions used in the finance app and the intercompany filter are added as well. Customer and supplier data can be ordered in a top view across time, p&l structure or other dimensions. By focusing on a specific part of the P&L we can present this data dynamically in insightful graphs and tables until postings level. Lastly there is also the possibility to dive into and export the data on a transaction line level.
- How does BrightAnalytics work?
- Connect: BrightAnalytics connects with accounting, ERP and CRM systems, and centralises all data in the BrightAnalytics platform.
- Report: The standard templates in BrightAnalytics are immediately ready for use, but can be fully tailored to suit one’s needs.
- Analyse: The management reports and dashboards offer a wealth of information and immediately provide clear insight into the figures of the entire organisation.
- Engage: The clear reports contribute to a better streamlined business strategy and execution, and ensure transparency within the company.
- What is the difference between Controlling Dimensions and Controlling Accounts
The primary difference between these modules lies in the depth of analysis. Controlling (Accounts) focuses on high-level financial monitoring using general ledger accounts and core KPIs to track overall results and cost structures. In contrast, Controlling Dimensions enables granular analysis by segmenting financial data across specific variables, such as projects, departments, or locations.
- Does BrightAnalytics connect with my package?
On the page https://www.brightanalytics.eu/integrations/ you can find a list of all our connectors.
- Does my package need to be a Cloud package?
No, your package does not need to be a Cloud package. BrightAnalytics links up with packages from the Cloud, on the server, or even Excel files.
- What is the difference between Customer & Supplier agings and Controlling Accounts?
Agings show you outstanding invoices for customers and suppliers, meaning invoices that have been sent but not yet paid.
Controlling Accounts show the revenues and costs that have actually been realized, meaning payments that have already been received or made.
See this app in action
- Watch the video
- Request a demo
By providing your details, you can access a video explaining our controlling app.
By leaving behind your details, you will be contacted for a personal demo explaining the controlling app.