Unlocking financial health
BrightAnalytics provides tools for businesses to understand financial data easily. This guide covers three key financial indicators: solvency, liquidity, and profitability. These insights aid decision-making and sustainable growth. Remember to compare ratios to industry standards and historical data for a comprehensive analysis.
Unlocking Financial health: Understanding Key Performance Indicators
In the dynamic world of modern business, deciphering financial data is crucial for organizational success. At BrightAnalytics, we understand the importance of empowering businesses with tools to navigate financial complexities effortlessly. In this guide, we explore three essential categories of financial performance indicators: solvency, liquidity, and profitability. Each category offers unique insights into different aspects of a company’s financial well-being, guiding decision-making and fostering sustainable growth.
However, it’s important to note that while these ratios provide valuable insights, they should not be viewed in isolation. Ratios are just indications and should usually be compared to industry standards, historical performance, and peers for a more comprehensive analysis. By leveraging this holistic approach, businesses can gain deeper insights into their financial health and make informed decisions to drive success.
1. Solvency
- Equity Ratio
The Equity Ratio gauges a company’s financial stability and leverage by assessing the proportion of assets financed by shareholders’ equity. A higher ratio implies greater financial strength and lower risk, while a lower ratio suggests higher leverage and potential financial risk.

- Equity to Debt Ratio
The Equity/Debt Ratio, also known as the Equity-to-Debt Ratio, provides insights into a company’s capital structure and financial leverage by assessing the proportion of financing from equity compared to debt.

- Retained Earnings Ratio
The Retained Earnings Ratio measures the extent to which a company funds its total assets with internal resources and profit. It serves as an indicator of financial strength and the proportion of assets generated and retained internally.

- Debt Coverage Ratio
The Debt Coverage Ratio assesses a company’s ability to meet total debt obligations using operating cash flow. A higher ratio indicates the company’s capacity to meet debt obligations internally, reflecting financial stability and solvency.

- Debt Ratio
The Debt Ratio highlights the proportion of a company’s total liabilities represented by debt. It is valuable for assessing financial risk, capital structure, and reliance on debt for financing. A high ratio may indicate higher financial leverage and potential risk, while a low ratio suggests a more conservative approach.

- Operating Cashflow Ratio: Operating Cash Flow – tag / Debt (Short Term) – tag
The Operating Cash Flow Ratio measures a company’s ability to cover short-term debt obligations with operating cash flow, demonstrating its capacity to meet immediate debt obligations using cash generated from core operations. - Net Financial Debt: (Debt (Short Term) – tag) + (Debt (Long Term) – tag) – (Cash – tag)
The Net Financial Debt metric measures overall indebtedness by considering financial liabilities (debts) and assets (cash and equivalents). It provides insights into a company’s overall financial health and its ability to meet debt obligations.

- Interest Coverage Ratio: EBIT – tag / Interest Expense – tag
The Interest Coverage Ratio assesses a company’s ability to meet interest obligations on outstanding debt. A higher ratio indicates better ability to cover interest expenses with operating income, while a lower ratio may suggest a higher risk of default.
2. Liquidity
- Current Ratio: Current Assets – tag / Debt (Short Term) – tag
The current ratio assesses a company’s short-term liquidity and its ability to cover its short-term debts and operational expenses with its short-term assets. It is calculated by dividing the current assets by the short-term debts. A value greater than one indicates that the company is likely able to meet its short-term obligations. However, an excessively high ratio may indicate an inefficient use of assets, potentially affecting profitability. A ratio below one suggests challenges in meeting short-term obligations with current assets.
- Days Sales Outstanding (DSO): (Accounts Receivable – tag / Turnover – tag) * 365
DSO indicates the average time a company takes to collect payments from customers. In BrightAnalytics, this is calculated by dividing Accounts Receivable by the last 12 months’ turnover, multiplied by 365 days. A lower DSO signifies faster payment collection, enhancing cash flow efficiency and liquidity.
- Days Payable Outstanding (DPO): (Accounts Payable – tag / Costs – tag) * -365
DPO measures the average number of days a company takes to pay its suppliers. Calculated by dividing accounts payable by the last 12 months’ costs, then multiplied by the number of days in a year. A higher DPO indicates that the company is taking longer to pay its suppliers, which can help preserve cash flow. However, very long DPO periods can impact a company’s creditworthiness and can negatively impact relationships with suppliers.
- Days Inventory Outstanding (DIO): (Stock – tag / Costs – tag) * -365
DIO measures how long it takes, on average, for a company to sell its entire inventory. It’s calculated by dividing the stock by the last 12 months’ costs, then multiplied by the number of days in a year. A lower DIO suggests efficient inventory management, while a higher DIO indicates slower inventory turnover.
- Cash Conversion Cycle (CCC): DIO + DSO – DPO
The Cash Conversion Cycle (CCC) measures the time it takes to convert its investments in inventory and accounts receivable into cash. Calculated as DIO + DSO – DPO, CCC represents overall working capital management efficiency.
- Net working capital (NWC): Current Assets – tag / Debt (Short Term) – tag
Net Working Capital is the difference between current assets and current liabilities. It represents the amount of capital available to a company for its day-to-day operations and is an essential indicator of a company’s short-term financial health.
- Cash Ratio: Cash – tag / Debt (Short Term) – tag
The cash ratio measures a company’s ability to cover its short-term debt obligations using its available cash and cash equivalents. It provides insights into the company’s liquidity and its immediate ability to meet its short-term financial obligations without relying on the conversion of other current assets.
- Quick Ratio: ((Current Assets – tag) – (Stock – tag)) / Debt (Short Term) – tag
The Quick Ratio, or Acid-Test Ratio, gauges a company’s ability to meet short-term obligations with its most liquid assets, excluding inventory for a more conservative measure than the current ratio.
- FCF: (Operating Cash Flow – tag) – (investing Cash Flow – tag)
Free Cash Flow (FCF) represents the cash generated by a company’s operations that is available for distribution to investors, debt reduction, or reinvestment in the business. It is an important metric for investors and analysts to assess a company’s financial health. It provides insights into the cash available for various uses, including returning value to shareholders or funding future growth initiatives.
3. Profitability
- EBITDA Margin: EBITDA – tag / Turnover – tag
The EBITDA Margin provides insight into a company’s profitability and operational efficiency by assessing the ratio of EBITDA to turnover. A higher ratio signifies effective management of operating costs and a healthier profit margin.
- Gross Profit Margin: Gross Margin – tag / Turnover – tag
The Gross Profit Margin measures a company’s profitability by evaluating the percentage of sales revenue remaining after deducting the cost of goods sold (COGS). It quantifies the efficiency of a company’s core operations in generating profit.
- Return on Equity (RoE): Profit after Taxes – tag / Equity – tag
Also known as “return on investment” (ROE), this ratio indicates how efficiently a company utilizes its equity capital to generate profits. A high ROE signals effective returns for shareholders, while a low ROE may suggest challenges in utilizing equity for profit generation.
- Profitability / Total Liabilities: Profit after Taxes – tag / Liabilities
This ratio assesses profitability in relation to the company’s total debt and obligations. It indicates the company’s ability to meet financial commitments to creditors. A higher value suggests that profits can cover total financial obligations, while a lower value may indicate potential financial risk.
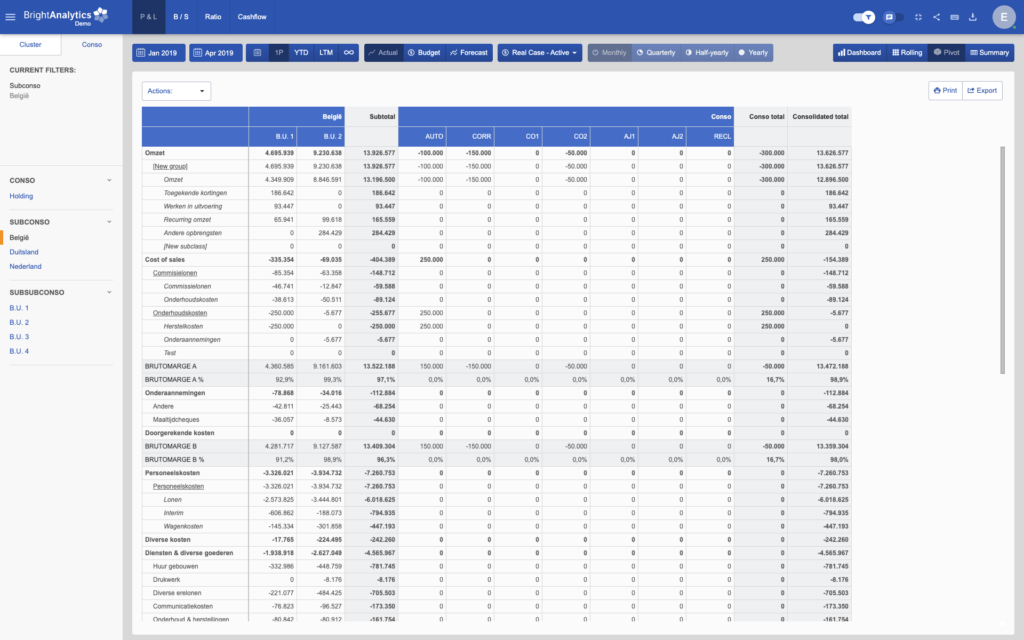
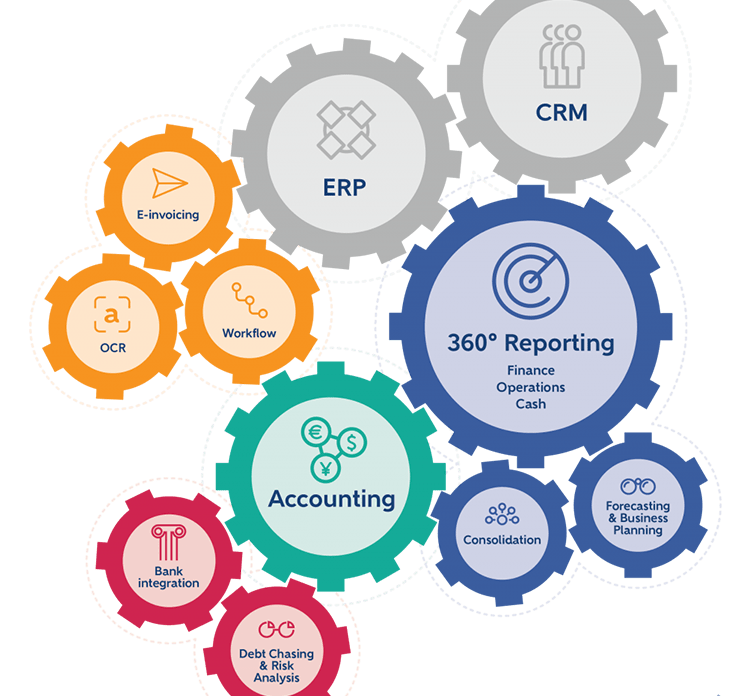
BrightAnalytics centralizes all your financial and operational data. The powerful and clear dashboards provide instant insight into the state of your business and put your operational data in context. Compare performances, build as many top 10’s as you like, or spot risks and anticipate trends in time.
BrightAnalytics offers a 360° overview of your organisation and allows you to make efficient, well-founded strategic decisions.
Would you like to know more about our solution? Sign up for one of our webinars or a demo.