
Management reporting that keeps up with your business
Most reporting delays come down to the same root cause: data spread across too many systems, pulled together by hand. Below, we break down what actually makes management reporting fast and reliable, and how BrightAnalytics is built to deliver it.

Why speed matters more than ever
As CEO or CFO, you don’t have time to chase numbers across five different tools before a board meeting. Every hour spent reconciling spreadsheets is an hour not spent on strategy. BrightAnalytics pulls your financial and operational data into one place, automatically. No more waiting on finance to manually stitch together last month’s numbers. When you open the platform, the data is updated, reconciled, and ready for review.
The 3 pillars of smart management reporting
Reporting software lives or dies on three things: where the data comes from, how much work it takes to maintain, and whether you can trust the number on the page. Here’s how BrightAnalytics handles each.

1. Real-time data, from any source
- Cloud or on-premises. BrightAnalytics connects either way, so your setup doesn’t have to change.
- Any source. Through BrightSync, we connect to over 400+ systems, including your accounting software, ERP, CRM, or time tracking tool. Whatever your stack looks like, we support it.
- Lowest level of detail. Data comes in at transaction level, not pre-aggregated, so nothing gets lost when you need to drill down.
How BrightAnalytics helps: Once a source is connected, it stays connected. Data is refreshed automatically on a daily basis, plus you can trigger a manual refresh whenever you need. That way, the platform you open Monday morning reflects Friday’s close, not last quarter’s.
2. Self-service reporting, no IT required
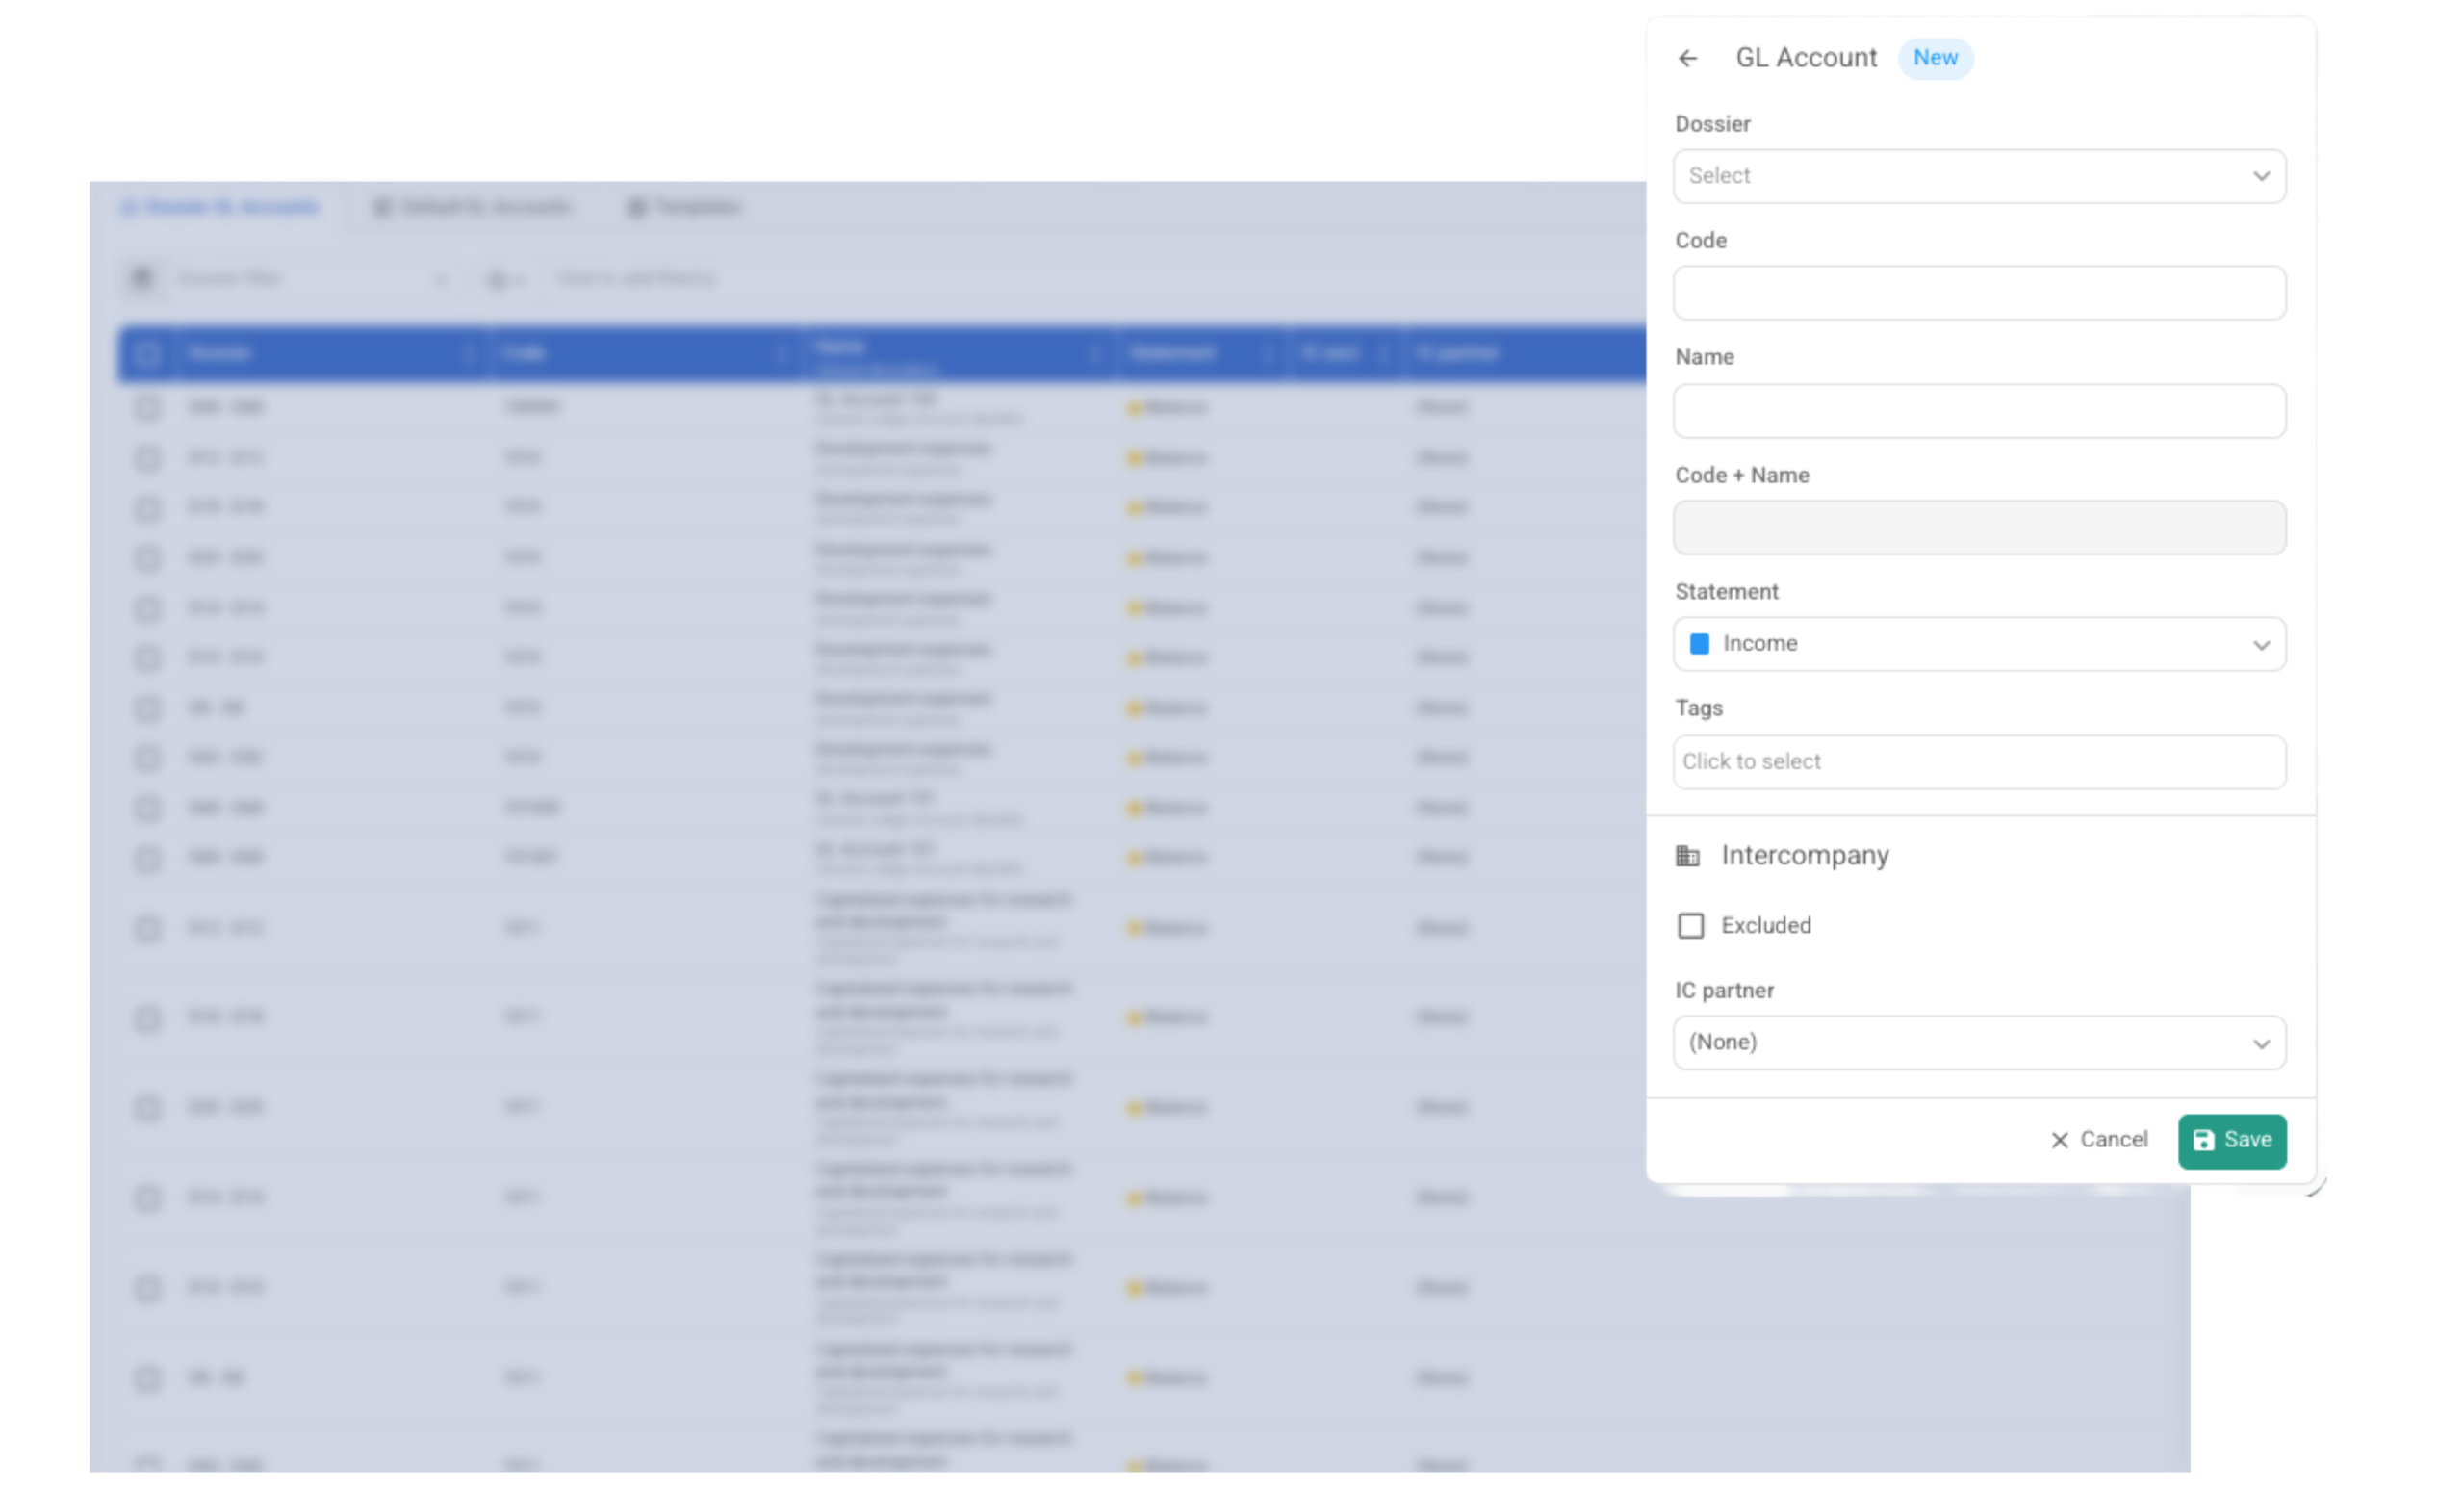
Waiting on IT or an analyst to build a report adds days to a process that should take minutes. BrightAnalytics gives finance teams a toolbox to build, adjust, and maintain their own reports. Financial reporting, cost analysis, KPI tracking, budgeting, forecasting, consolidation, and more all live in one platform.
How BrightAnalytics helps: Reports are built and adjusted directly in the platform, without a help ticket or a wait time.
3. Built-in logic you can trust
The platform is only as reliable as the process behind it. Manual data entry introduces manual errors, which is a risk finance teams can’t afford when numbers go to the board. BrightAnalytics automates the reporting logic itself, not just the data pull. That means fewer manual touchpoints between your source systems and the report your board sees.
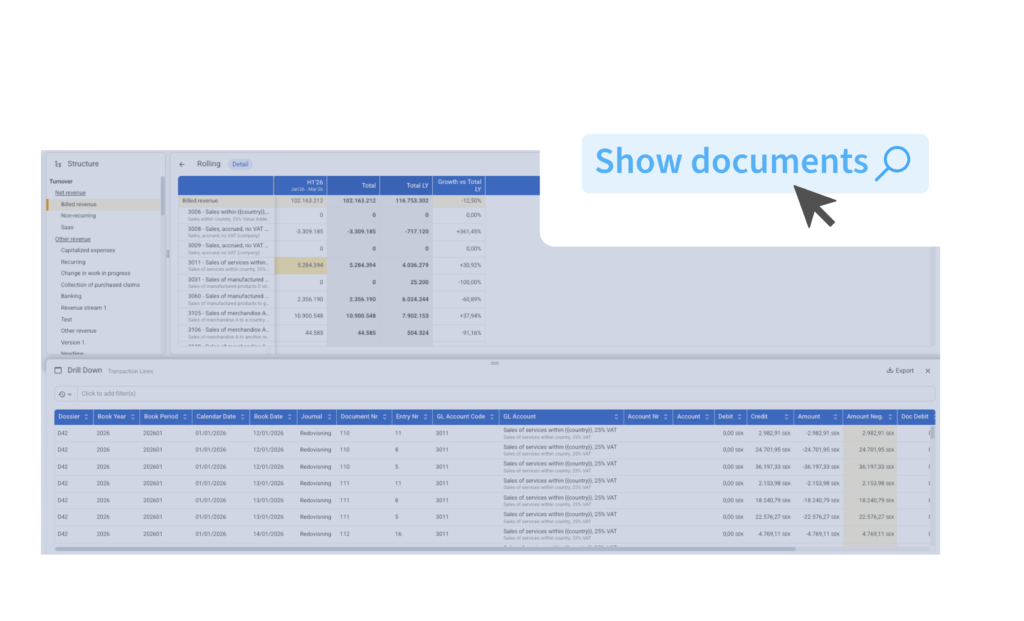
How BrightAnalytics helps: The number in the platform matches your ERP or bookkeeping system, with no copy-paste and no version drift. No need to look up numbers in your source software: just drill down to see the underlying transaction details in the platform.
Core features of our management reporting platform
One single version of the truth. All your management reporting data lives in a single platform, so every team works from the same numbers. No more reconciling three versions of the same report before a meeting.
Hear it from our customers

Report faster, with fewer manual steps
With BrightAnalytics, you get real-time data, self-service reporting, and automated logic in one platform, backed by a team that helps you set it up correctly from the start.
- What is management reporting?
Management reporting is the process of pulling together financial and operational data to give leadership a clear, regular view of how business is performing. It typically covers things like P&L, cash flow, budget vs actuals, and KPIs, used to support decisions rather than just satisfy compliance requirements.
- What is the difference between management reporting and financial reporting?
Financial reporting is built for external parties like auditors, investors or tax authorities, and follows fixed accounting standards. Management reporting is for internal use: it’s more flexible, more frequent, and built around the questions your leadership actually needs answered.
- What is BrightAnalytics?
BrightAnalytics is the most intuitive, reliable and fast management reporting platform that covers all needs on management reporting and consolidation.
- How does BrightAnalytics work?
- Connect: BrightAnalytics connects with accounting, ERP and CRM systems, and centralises all data in the BrightAnalytics platform.
- Report: The standard templates in BrightAnalytics are immediately ready for use, but can be fully tailored to suit one’s needs.
- Analyse: The management reports and dashboards offer a wealth of information and immediately provide clear insight into the figures of the entire organisation.
- Engage: The clear reports contribute to a better streamlined business strategy and execution, and ensure transparency within the company.
- What is BrightSync?
BrightSync is the technology behind BrightAnalytics that connects to your data sources, over 400 accounting systems, ERPs, CRMs, and more, and pulls transaction-level data into the platform automatically.
- Who is BrightAnalytics?
BrightAnalytics is a growing technology company. Our goal is to help companies streamline their management reporting processes.