
BrightAnalytics: a BI Book alternative for financial reporting and consolidation
Looking for a BI Book alternative? BrightAnalytics is a consolidated management reporting platform that brings financial reporting, budgeting, forecasting, and group consolidation together in one place, connected directly to your source systems so your numbers stay accurate and current.
Why companies choose BrightAnalytics
1. Reporting that doesn’t send you to external BI consultants
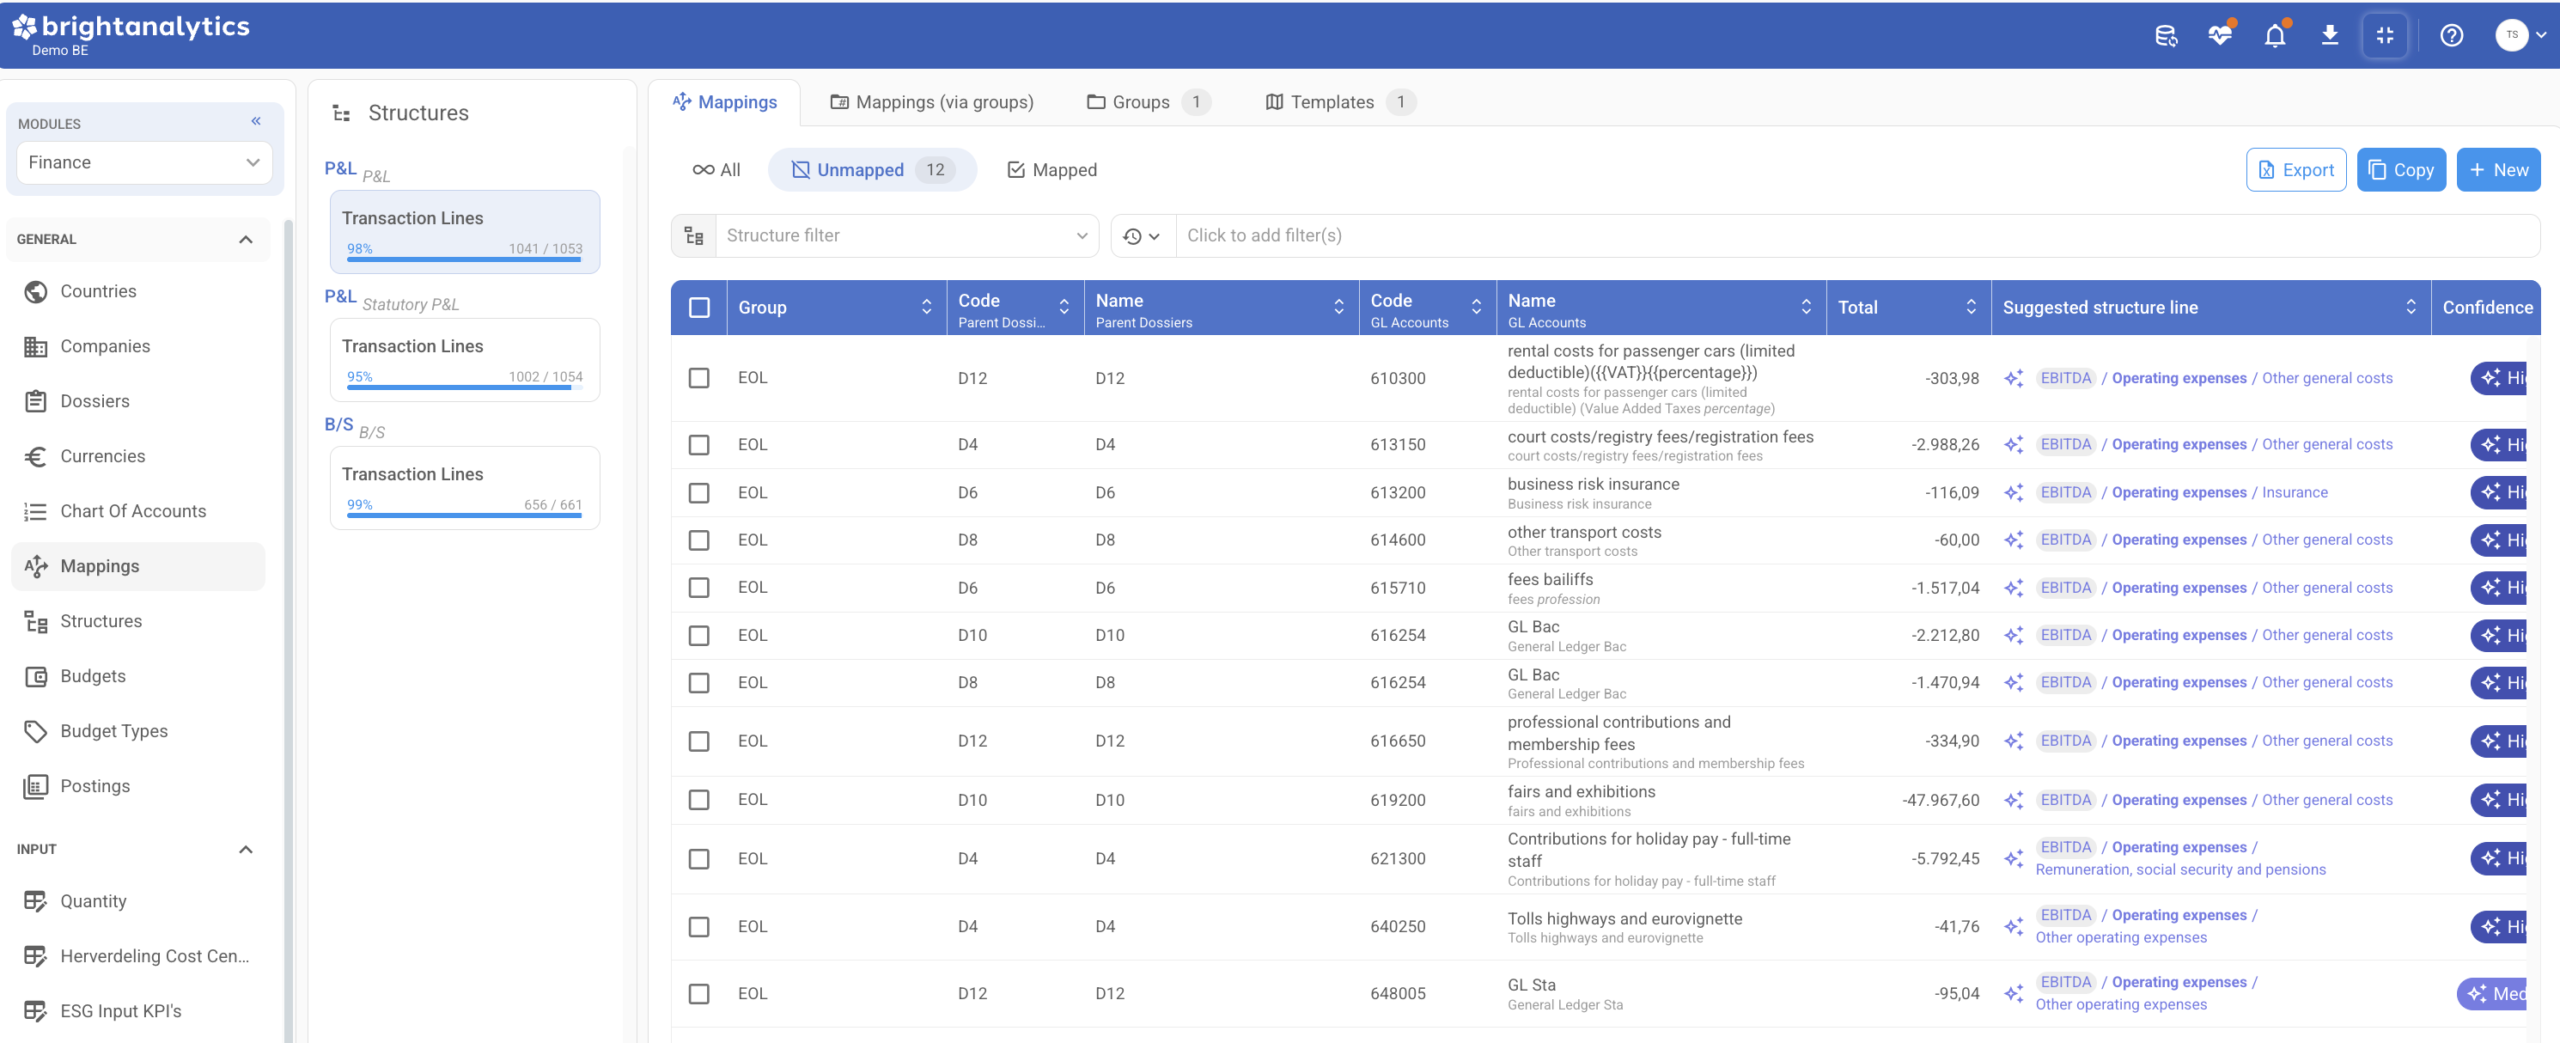
Many reporting setups need technical BI expertise or consulting hours every time a report needs adjusting. BrightAnalytics builds interactive dashboards and financial logic directly into the platform, so finance teams can start reporting from day one instead of building data models first. Wondering how that differs from a Power BI setup?
See how BrightAnalytics and Power BI compare.
- No BI expertise required: Pre-built financial logic handles reporting out of the box, so you manage and report from the same place without writing code.
- Self-service control: Structures, mappings, dashboards, and user permissions can all be modified directly in our admin panel.
- Deep transactional drill-down: Pull live data down to general ledger accounts, transaction postings, and original scanned invoices.
2. Consolidation built for complex group structures
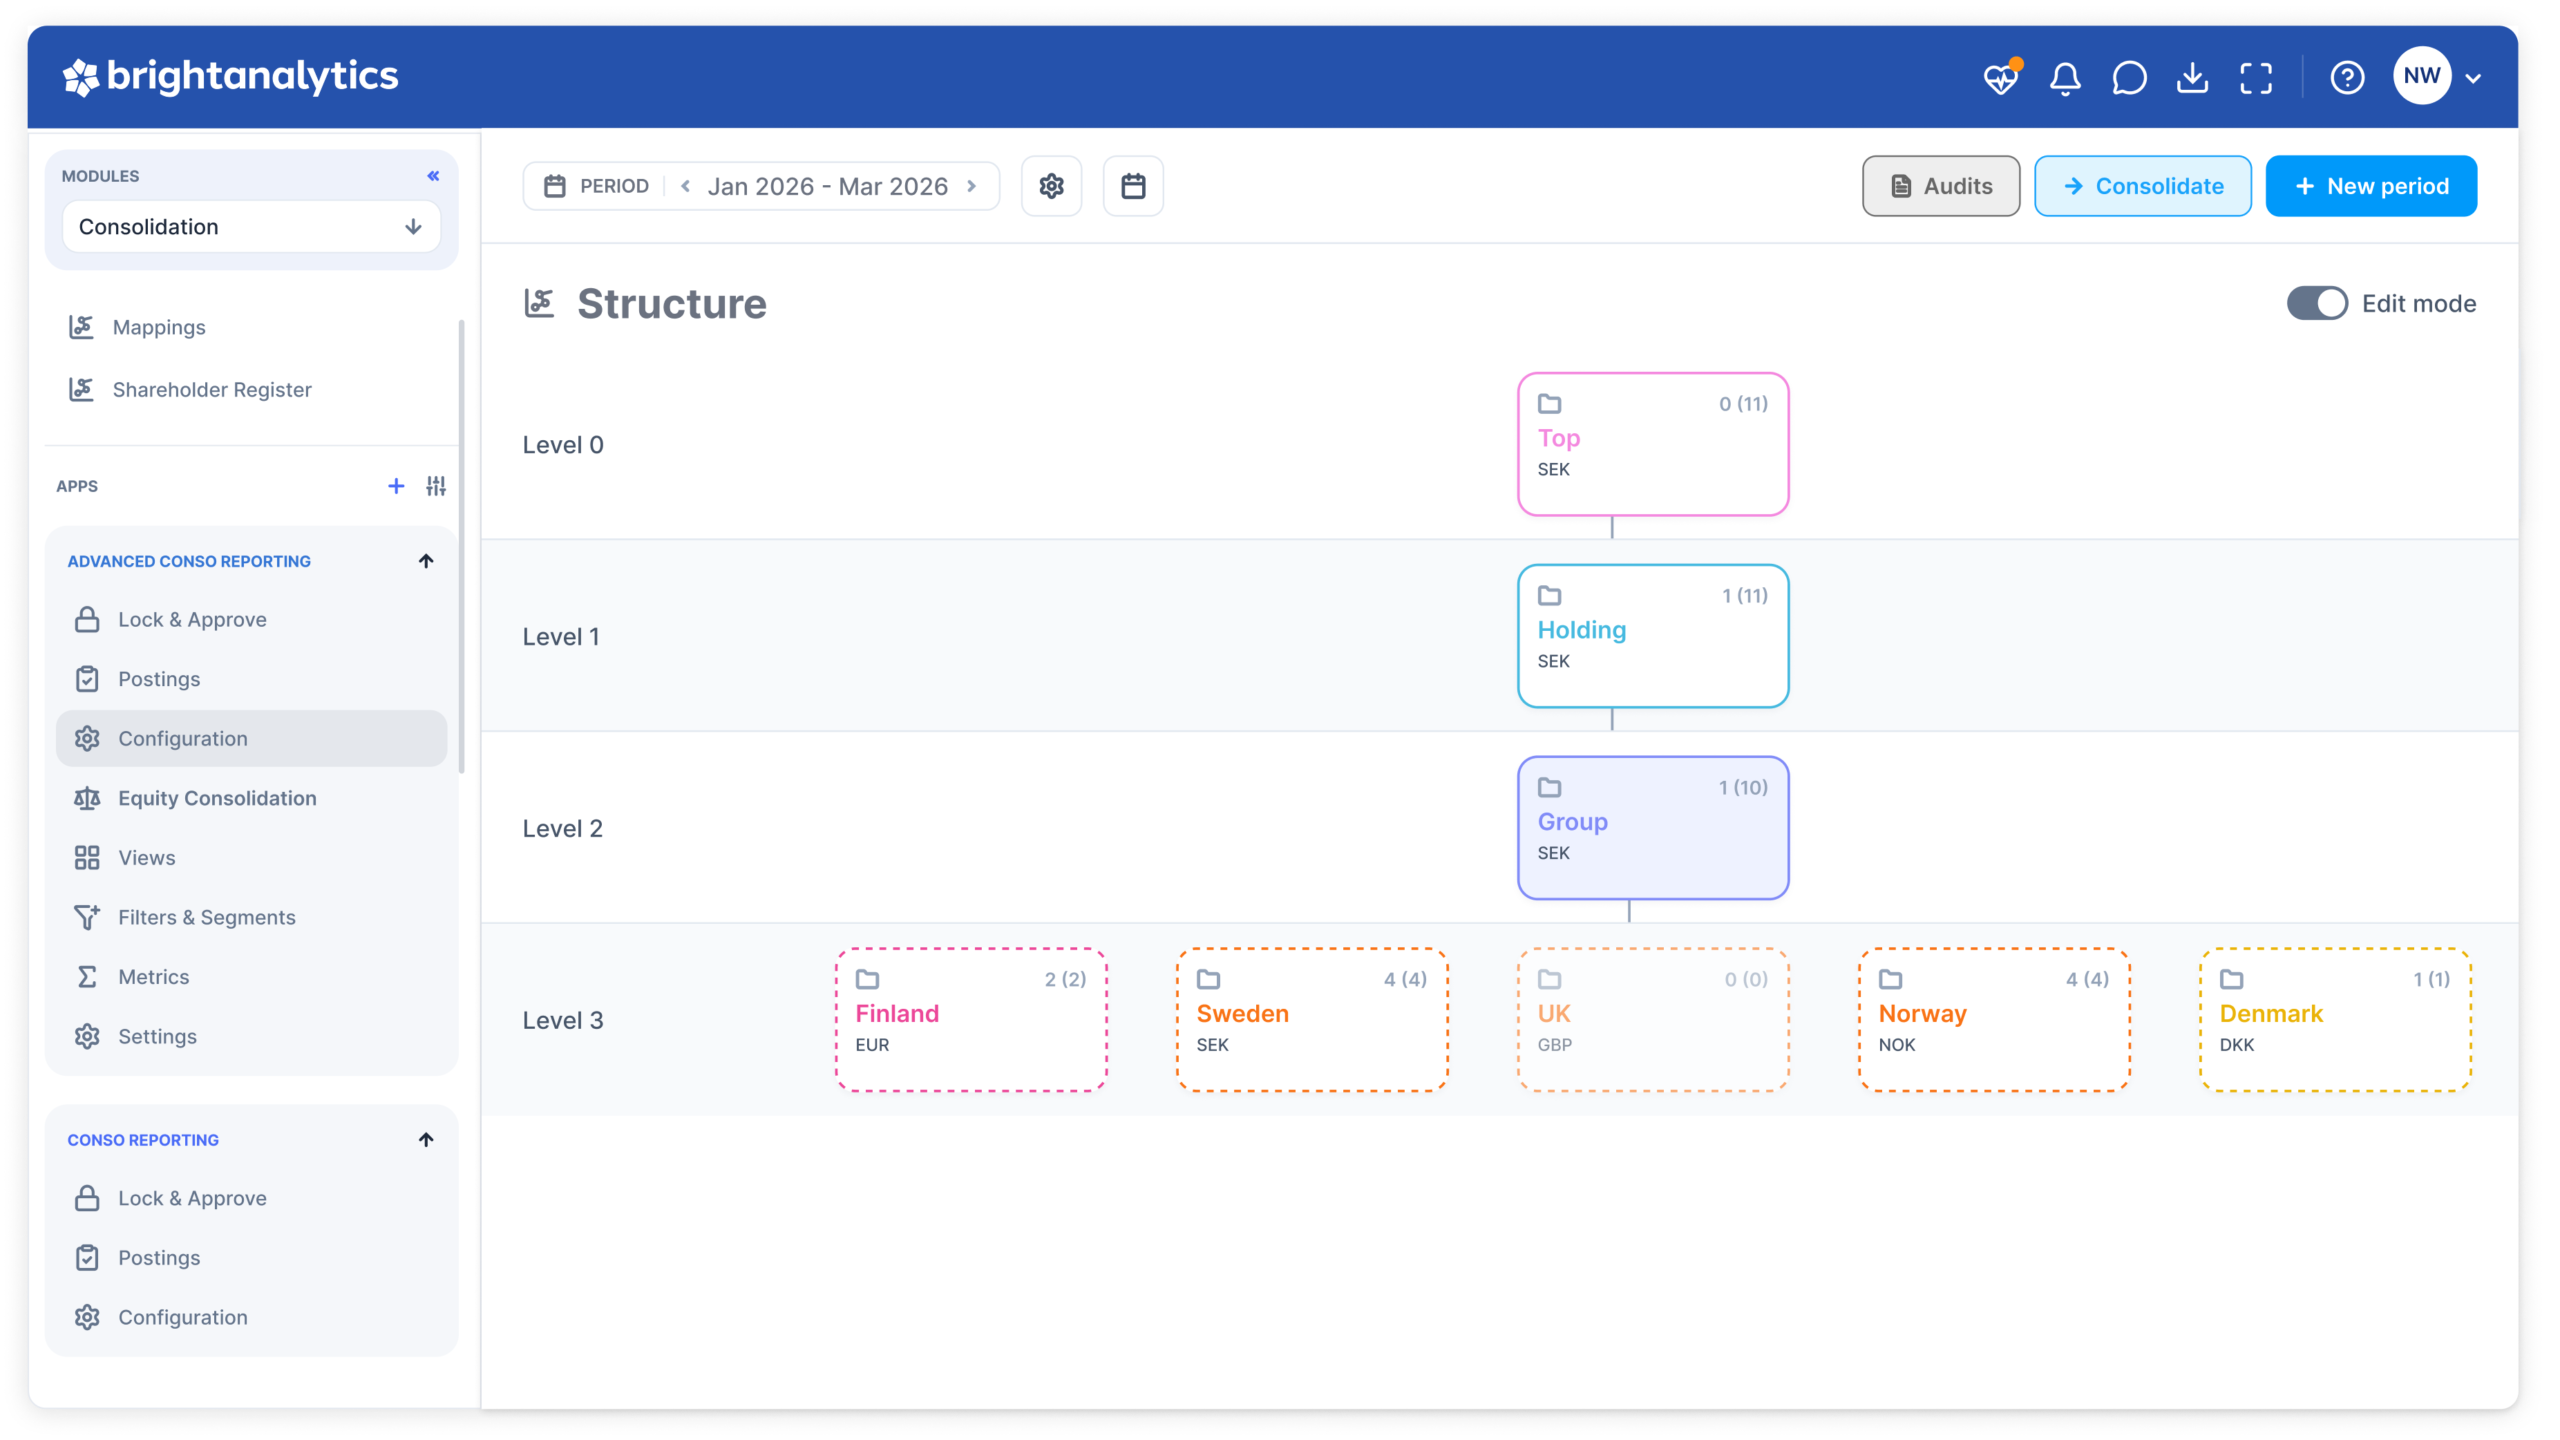
Once you run more than one entity, reporting is only half the job. With BrightAnalytics, consolidation runs on the same data and in the same platform as your reporting, so group figures don’t have to be pieced together in spreadsheets at month-end.
- Automatic intercompany eliminations: Integrated AI matches intercompany transactions across entities and eliminates them at transaction level.
- Multi-currency handled for you: Exchange rates from central banks like the ECB and Sveriges Riksbank are applied automatically.
- From group view to entity detail: Move from consolidated figures down to a single entity and the transactions behind it.
3. One platform across finance and operations
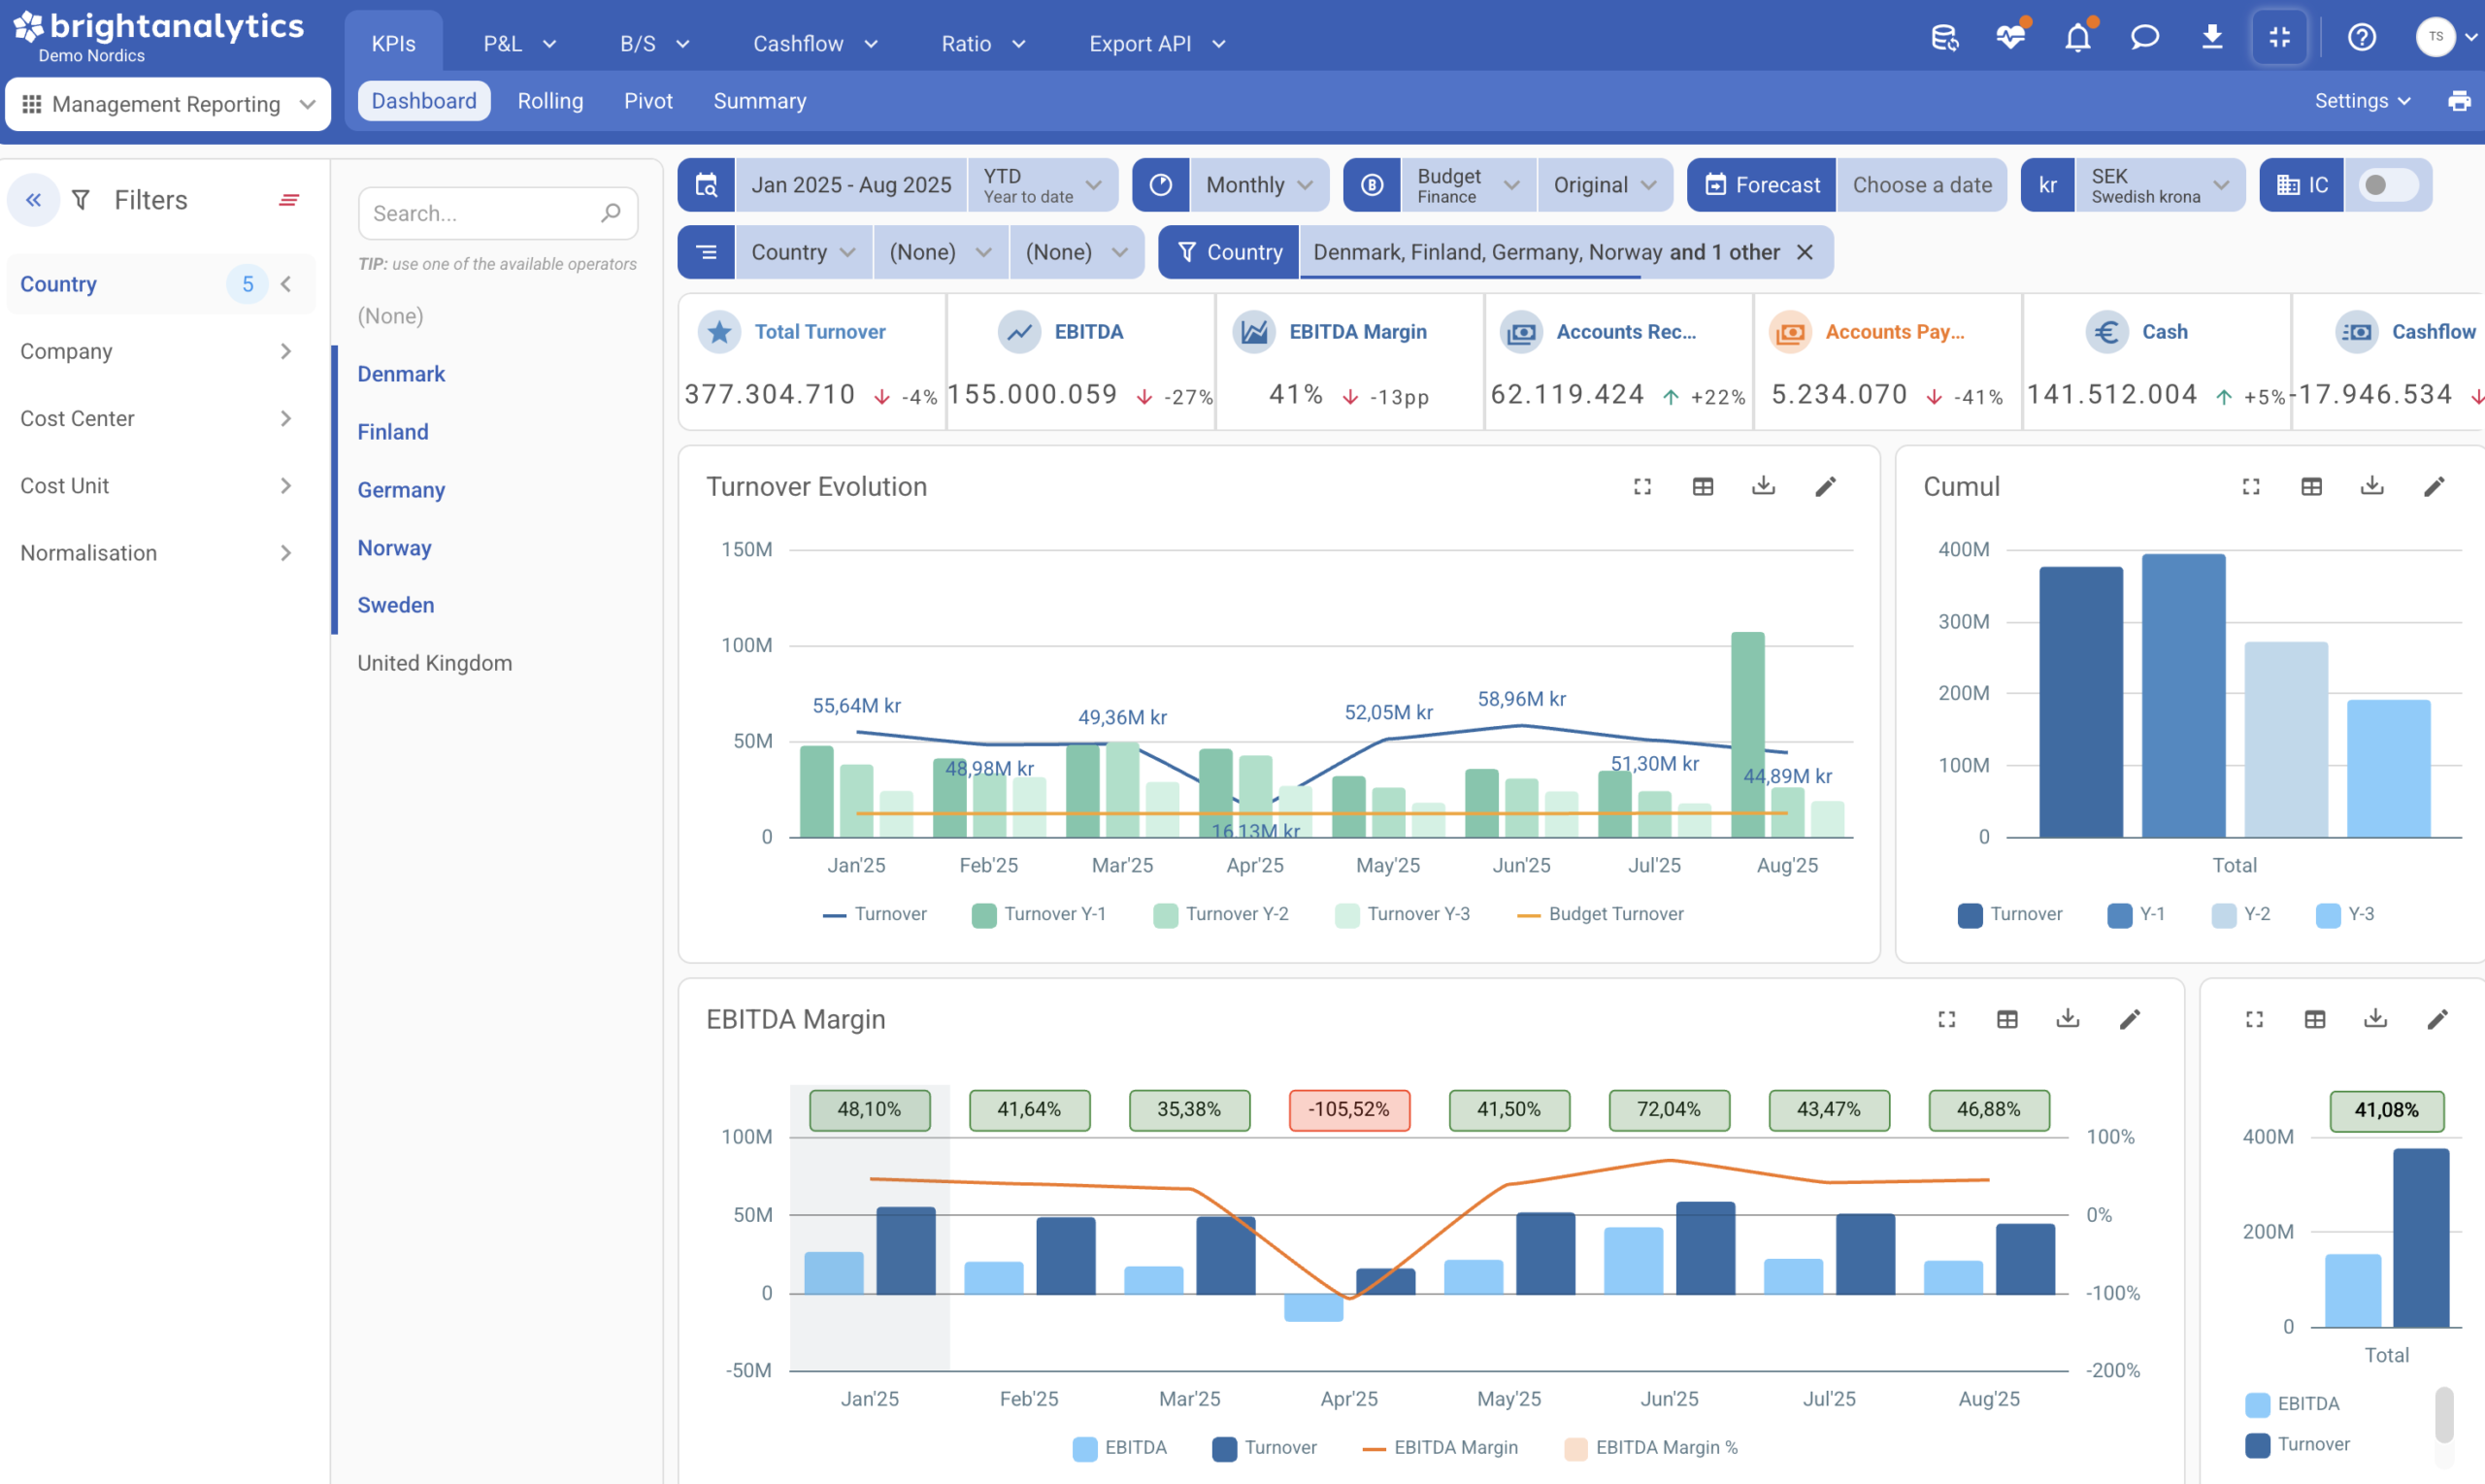
Instead of piecing together custom Power BI data models, BrightAnalytics runs all modules on the exact same data foundation:
- Core financials & cash: Access P&L statements, balance sheets, cash flow reports, and Cash Forecasting in one central place.
- Operational KPIs: Track non-financial metrics, such as SaaS KPIs, billability, project margins, and sales funnels, alongside core financial actuals.
4. Fast, direct integrations for Nordic software landscapes
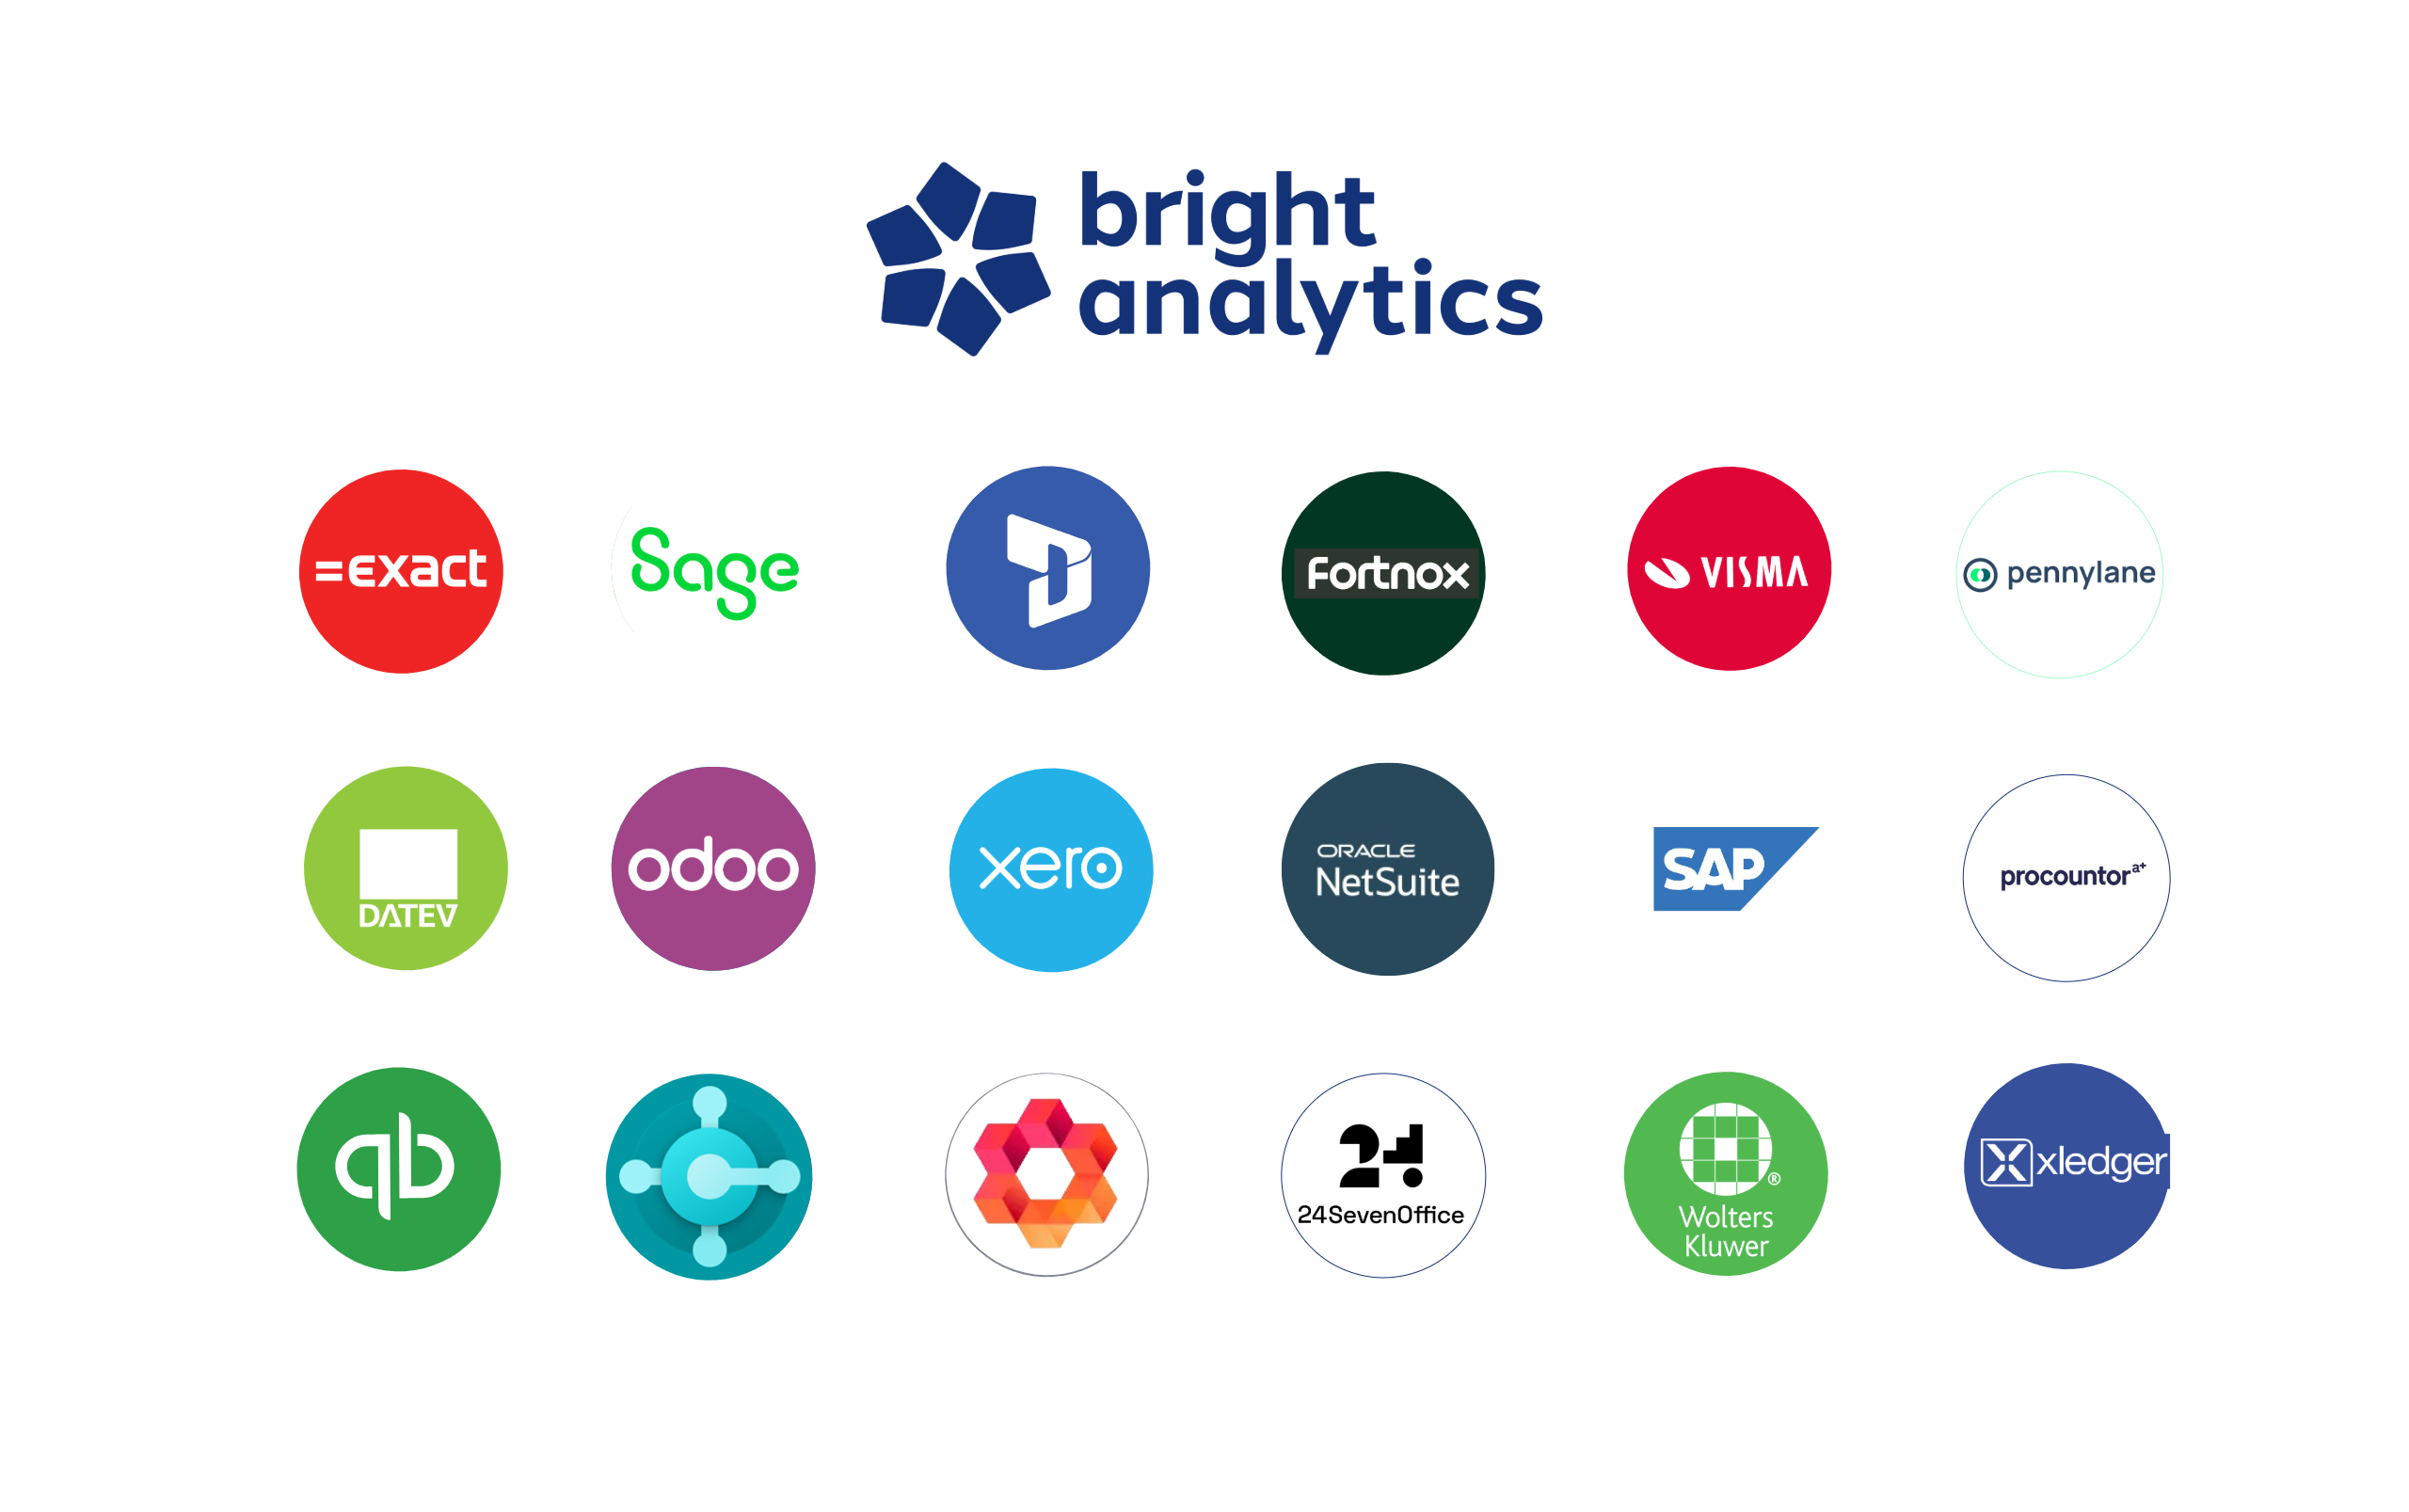
We connect to your cloud or on-premises accounting, ERP, and CRM systems through over 450 + pre-built direct API connectors. That includes popular Nordic systems like Fortnox, Visma, 24SevenOffice, PowerOffice, Jeeves, and Microsoft Dynamics alongside global platforms like SAP, Exact, NetSuite, and Odoo.
If your system isn’t on the list, we typically build the connector in a matter of weeks. BrightAnalytics sits as a direct layer on top of your source systems, so you spend your time analyzing data instead of gathering it.
5. Embedded AI that automates routine finance work

Artificial intelligence is integrated directly into BrightAnalytics:
- Instant anomaly detection: An AI controller continuously scans figures against prior periods to flag unexpected cost spikes or deviations before closing.
- Automated account mapping: Built-in AI suggests general ledger account mappings when onboarding new entities and learns from your past approvals.
- AI-assisted reconciliation: Automatically links sales and purchase invoices across entities to resolve intercompany discrepancies.

Ready to see how it works for your business?
Closing periods and board prep don’t have to mean long hours, manual file uploads, or waiting on specialists for report changes. Book a demo to see how BrightAnalytics fits into your setup.
- Do you have different managing directors for each of your legal entities?
Give them access to all data related to their business unit.
- Do you have key account managers?
Give them access only to each of their own customers, so they can follow up based on the outstanding invoices.
- Do you have board members?
Give them access to all data, but don’t let them drill beyond a certain of detail.
You can set restrictions for any person/role you want.
That means anyone who has access to the platform, will immediately have a 360° view of the data they are interested in. It is no longer necessary to distribute static Excel reports that are outdated the moment you send them out.