
FP&A
Managing plans across multiple entities, currencies, and business units does not have to mean spreadsheet chaos. BrightAnalytics unifies your operational and financial data into one intuitive space for real-time forecasting and budgeting.
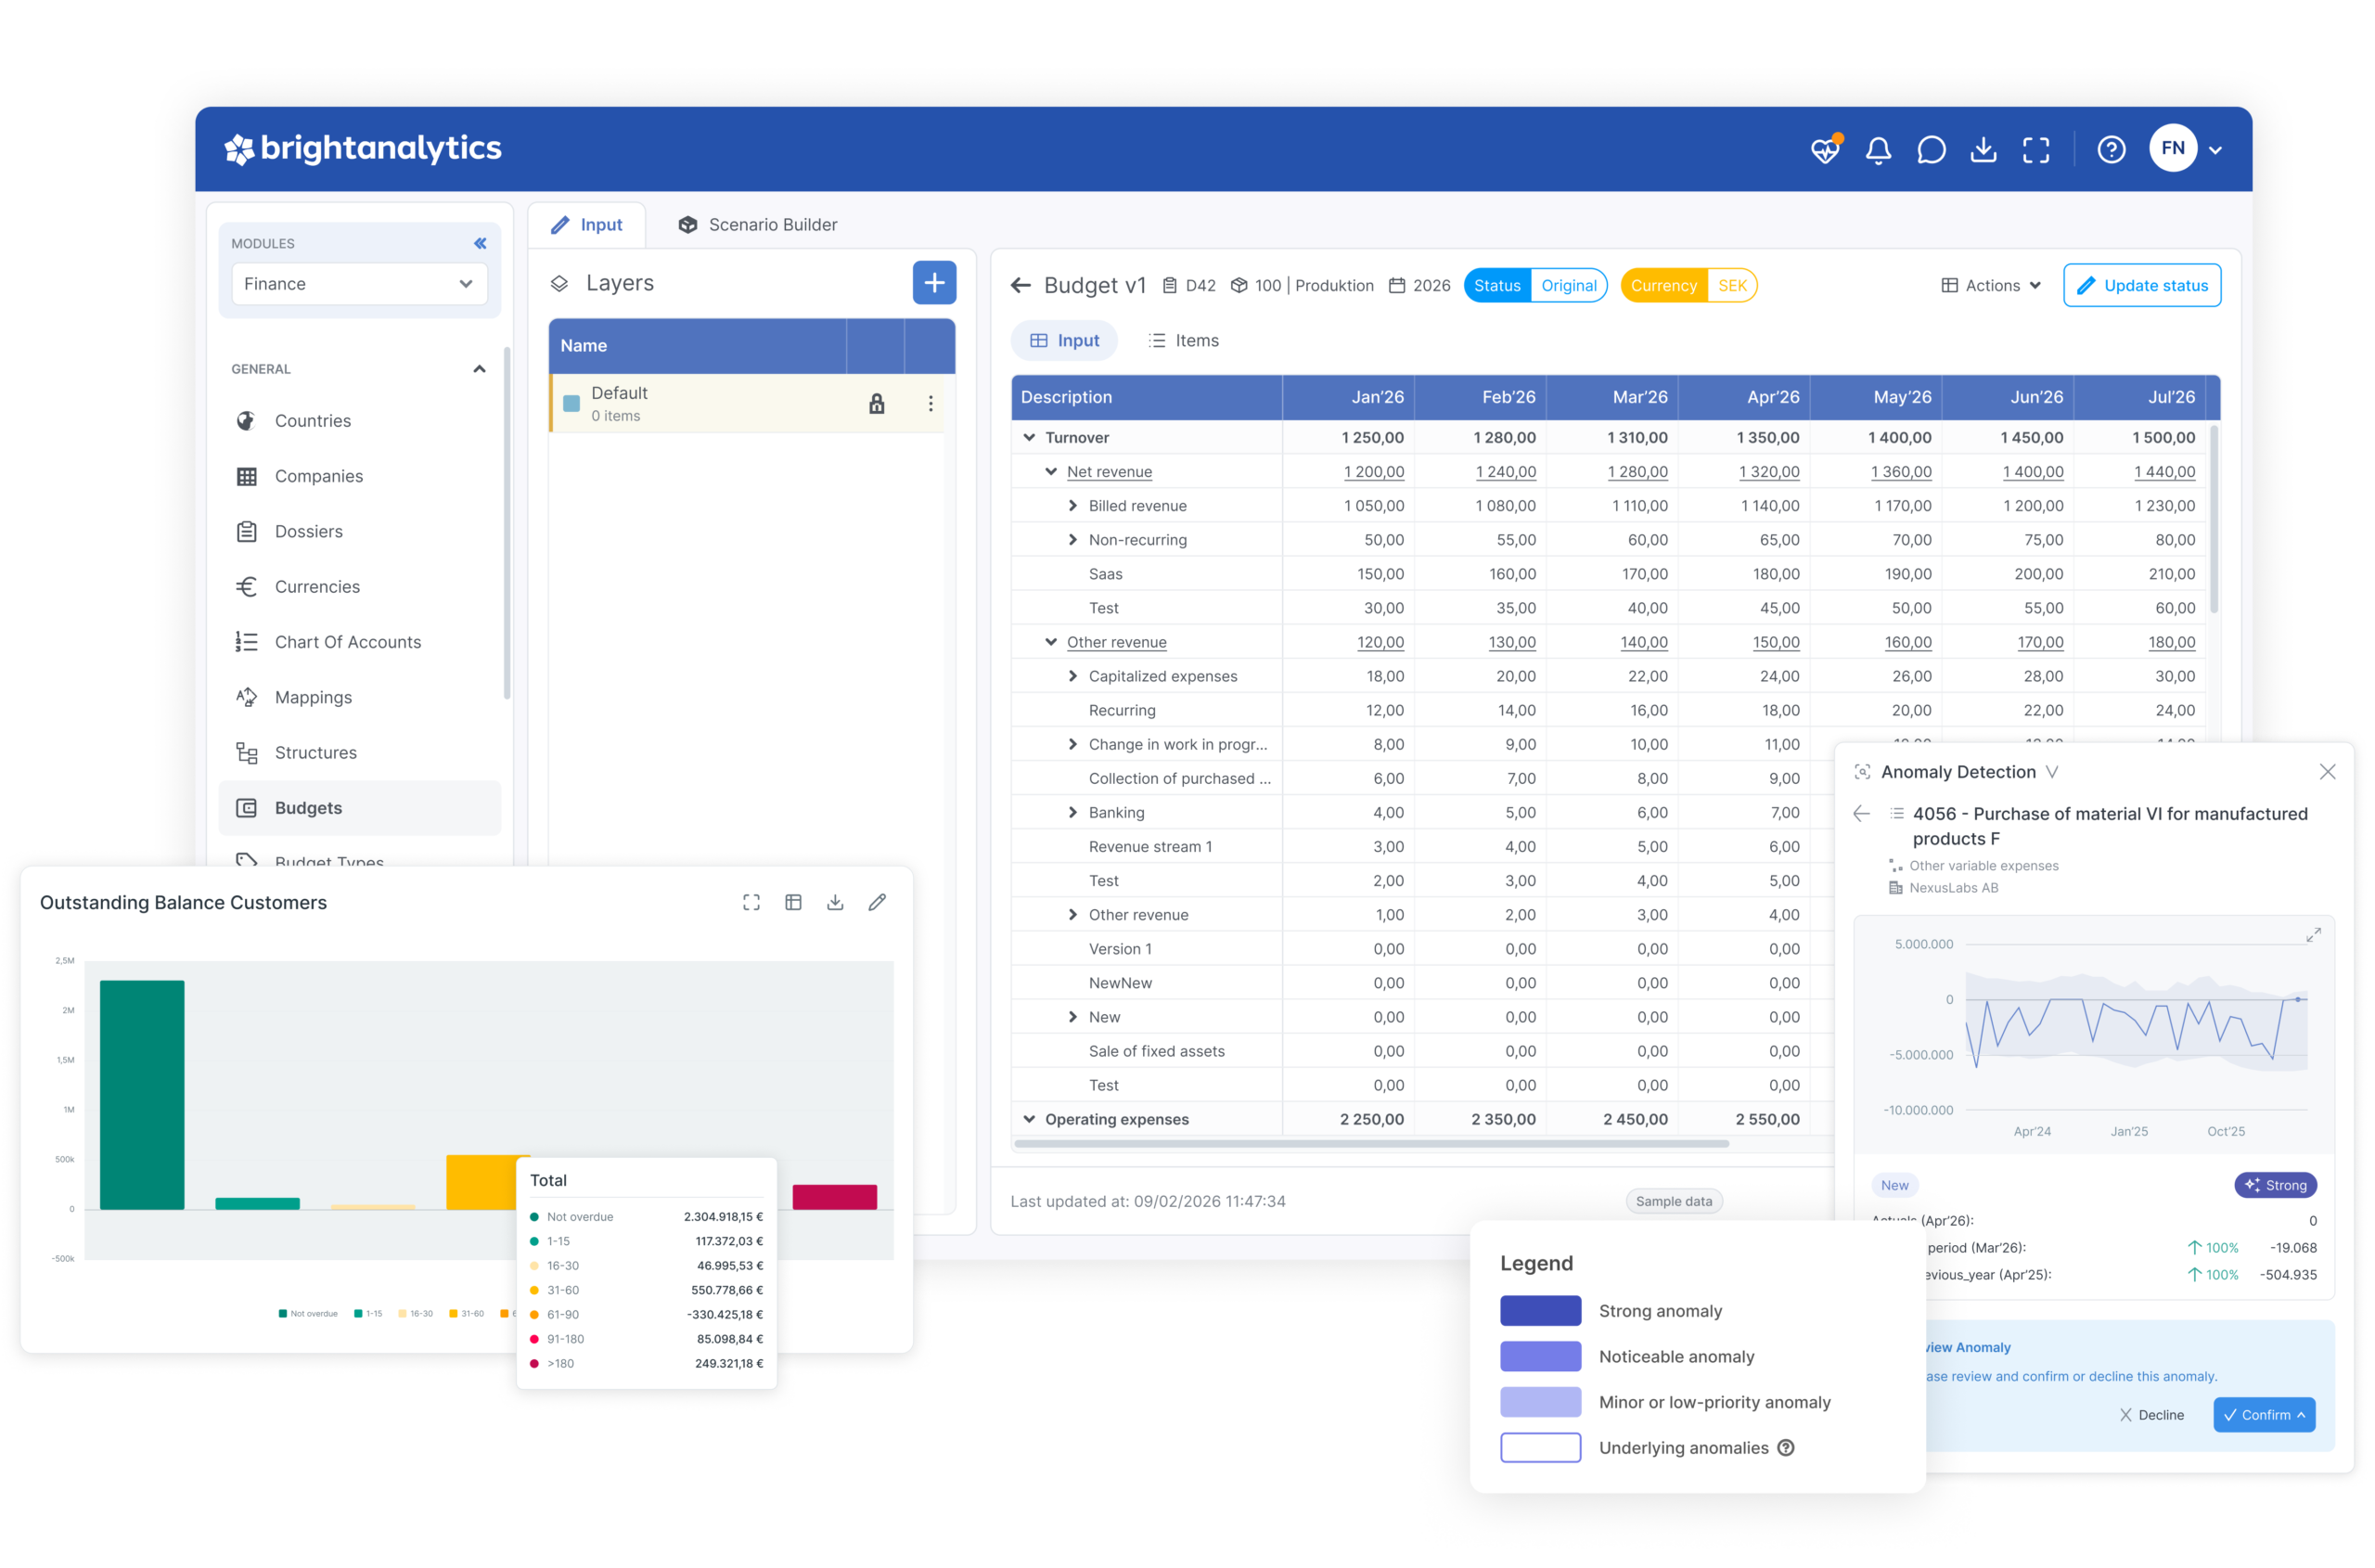
Plan, forecast, and control, all in one platform
Stop dealing with fragmented spreadsheets, late-night fixes and month-end budget surprises. With BrightAnalytics you can budget against real numbers, model what’s next, and catch problems before they show up in the board deck, giving your finance team one platform where nothing gets rebuilt twice.
Overview
Connect your actuals to your forecasts without manual data entry. BrightAnalytics gives you a single place to manage budgets, run scenario models, and track performance across all your business units.
Budget
Build budgets, forecasts, and rolling forecasts directly in BrightAnalytics, on the same data as your actuals. Budget by P&L line, account, customer, or supplier, in local or group currency. Work with drivers, or let automated trend budgeting give you a starting point based on past performance. Prefer starting in spreadsheets? You can still import and export budgets from Excel whenever you need to.
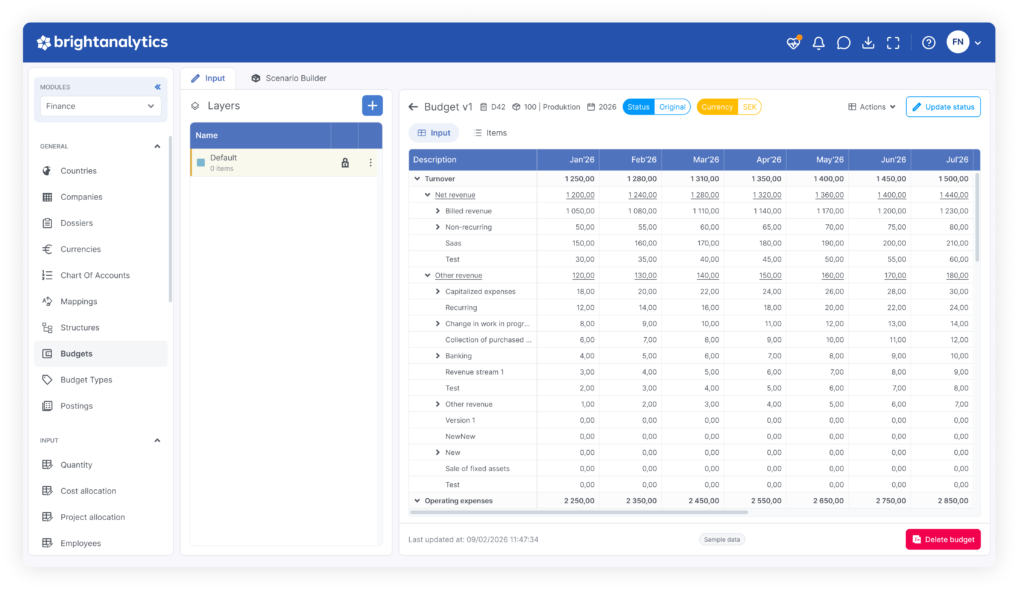
Budget versions and approval
Lock a budget once it’s approved so nothing changes after the fact. Every budget and forecast stays in one place, so you can compare versions against each other and see how expectations have shifted over the year.

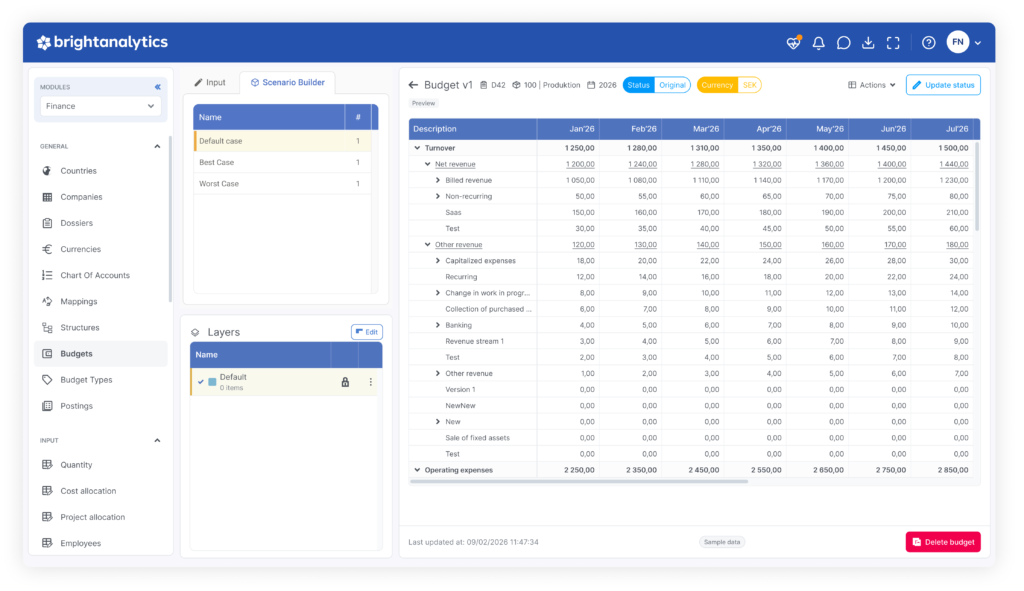
Scenario builder
Model what-if, base case, best case and worst case scenarios directly on your live data, and see the impact before you decide.
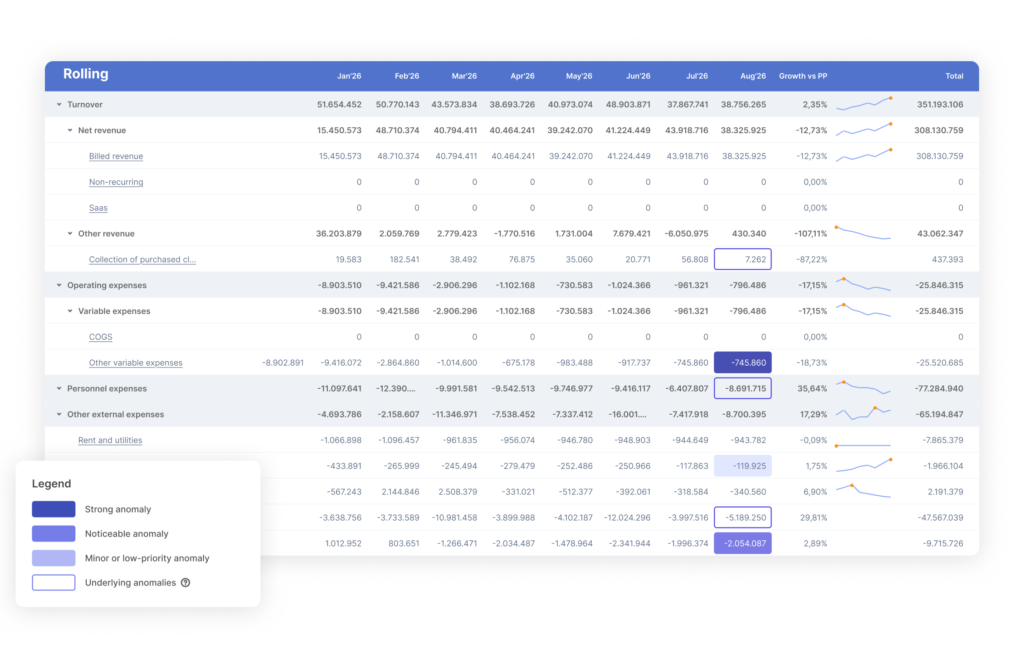
Virtual controller
With BrightAnalytics AI, variances and anomalies get flagged automatically, so your team spends less time checking numbers and more time explaining them.
Controlling views
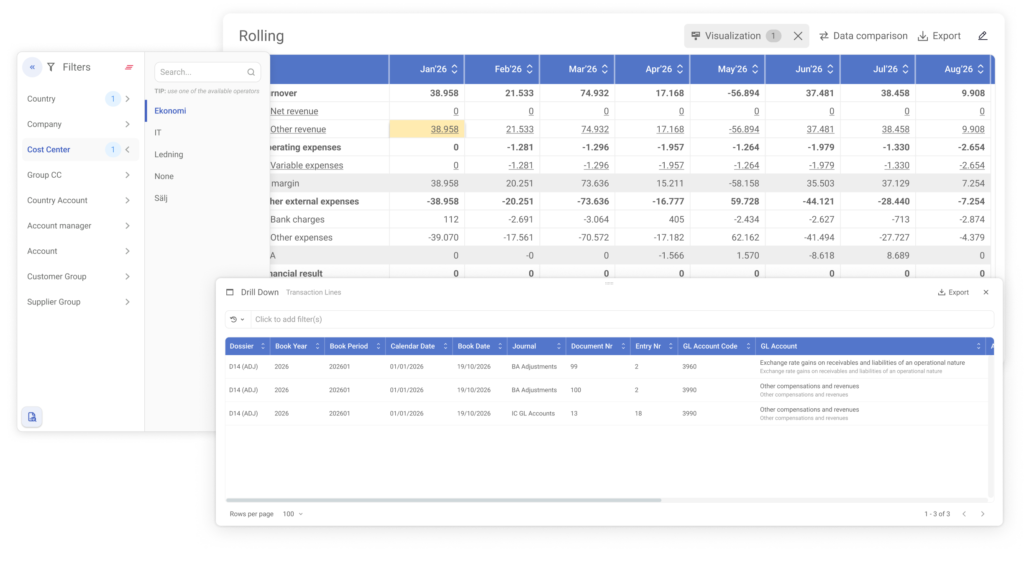
Analyze performance by customer, supplier, project, or any available dimensions, not just by GL account. Self-service dashboards run on the same live data as your reporting, so everyone works from one set of numbers.
Customers & suppliers (cash aging)
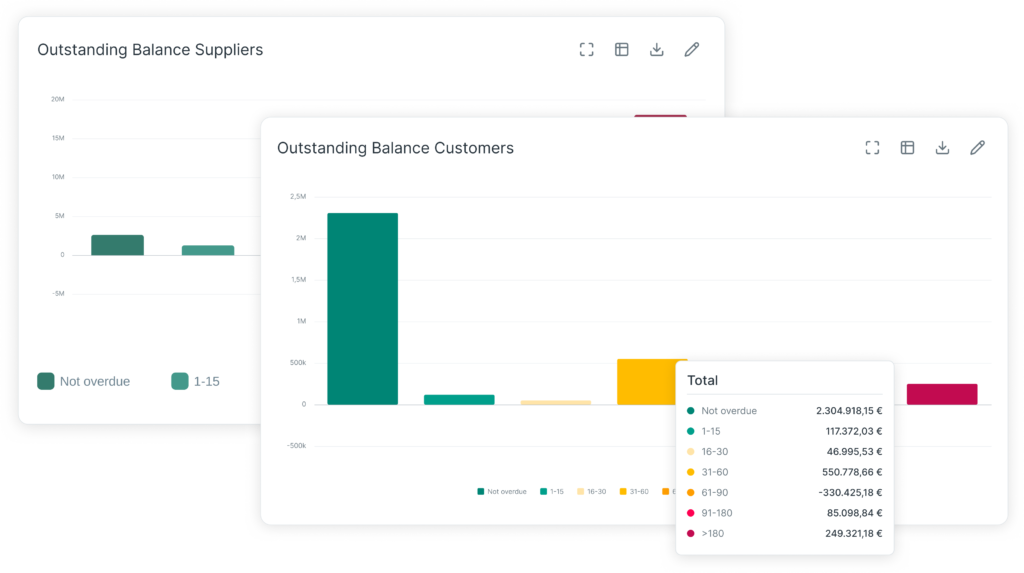
See every open invoice to and from customers and suppliers in one place, even when your entities run on different accounting systems. The overview updates daily, so you can follow up on overdue payments, see when payment terms expire, and track payment behavior through Days Sales Outstanding (DSO) and Days Payable Outstanding (DPO).
Cash forecasting
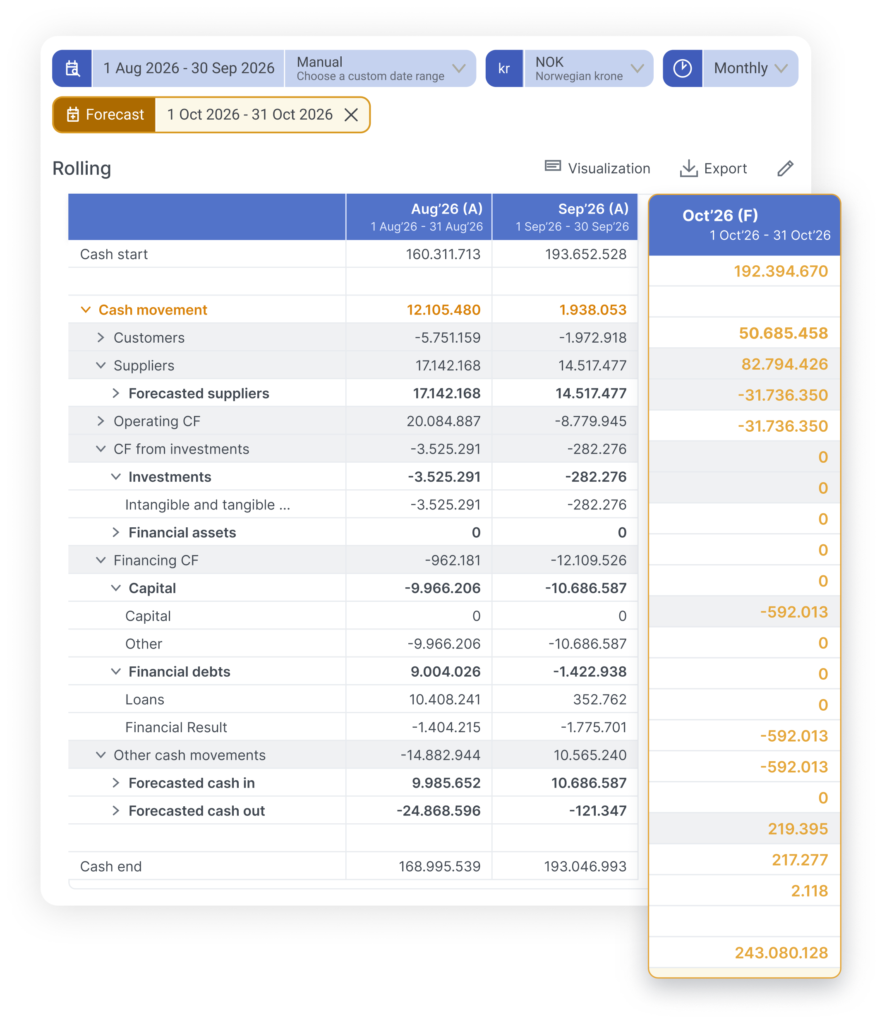
See where your cash is heading and spot shortfalls while there’s still time to act. Combine actuals, budgets, planned investments, and open invoices from all your entities’ accounting systems to predict your future cash position.
AI in FP&A


Discover our apps





- Who is BrightAnalytics?
BrightAnalytics is a growing technology company. Our goal is to help companies streamline their management reporting processes.
- What is BrightAnalytics?
BrightAnalytics is the most intuitive, reliable and fast management reporting platform that covers all needs on management reporting and consolidation.
- How does BrightAnalytics work?
- Connect: BrightAnalytics connects with accounting, ERP and CRM systems, and centralises all data in the BrightAnalytics platform.
- Report: The standard templates in BrightAnalytics are immediately ready for use, but can be fully tailored to suit one’s needs.
- Analyse: The management reports and dashboards offer a wealth of information and immediately provide clear insight into the figures of the entire organisation.
- Engage: The clear reports contribute to a better streamlined business strategy and execution, and ensure transparency within the company.
- How do I connect BrightAnalytics to my package?
With our BrightSync we connect to more than 400 data sources. One of the biggest USP’s of the solution is our possibility to connect with every system.