
Financial Reporting
Stop wasting days pulling data into static spreadsheets. BrightAnalytics automates your financial reporting from start to finish, delivering a real-time, single source of truth so your team can focus on analyzing the numbers, not compiling them
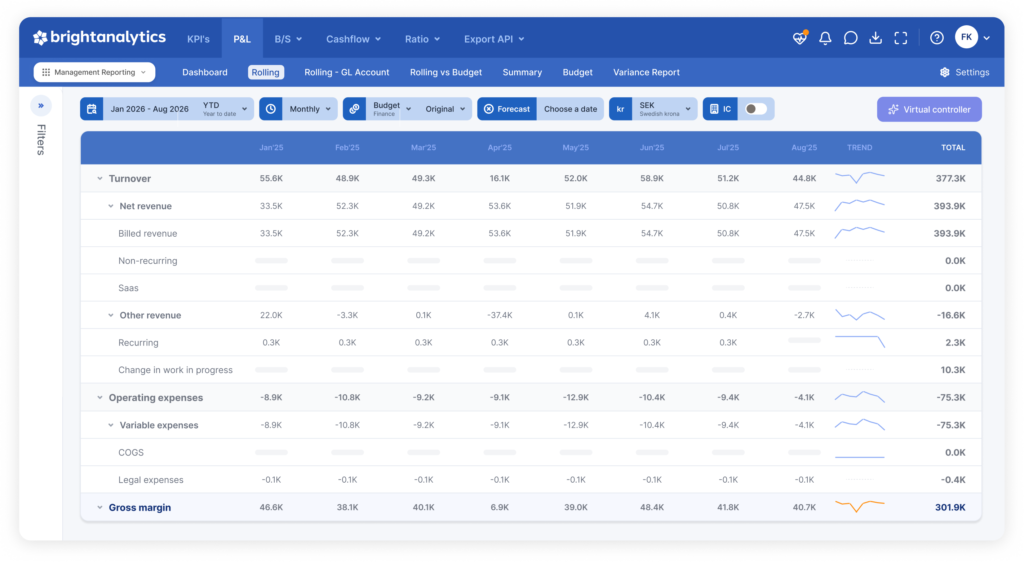
Your P&L, balance sheet, and cash flow, always current and always explainable
Financial reporting shouldn’t mean waiting on someone to export, map, and reconcile numbers before anyone can look at them. BrightAnalytics reads your data straight from source, applies your GL mapping and currency logic automatically, and gives you reports you can drill into the moment the numbers land.
Overview
P&L, balance sheet, and cash flow
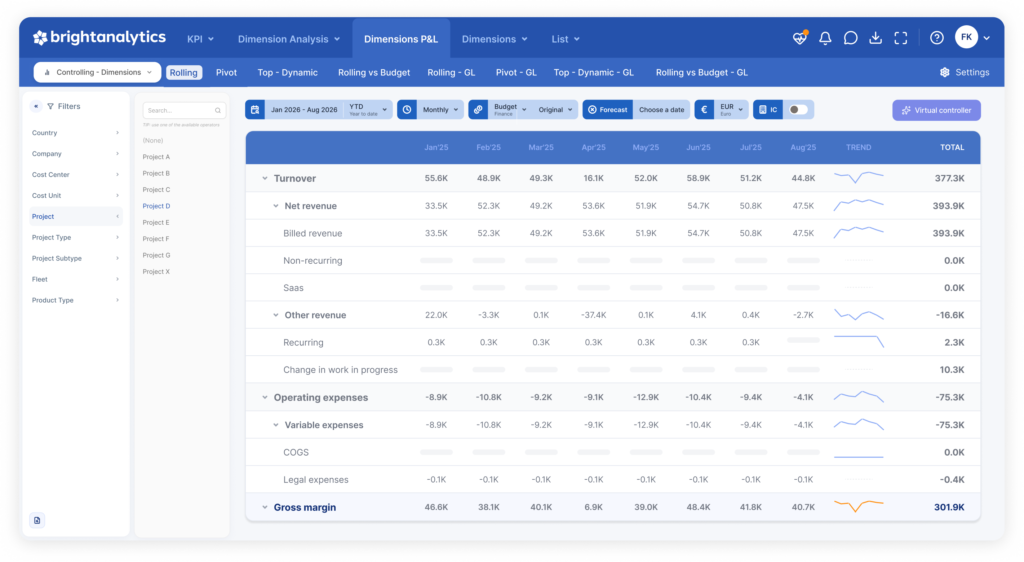
Work from customizable dashboards with rolling views, comparisons, and pivot tables. The balance sheet follows the same structure and logic as the P&L, so switching between them doesn’t mean relearning the report.
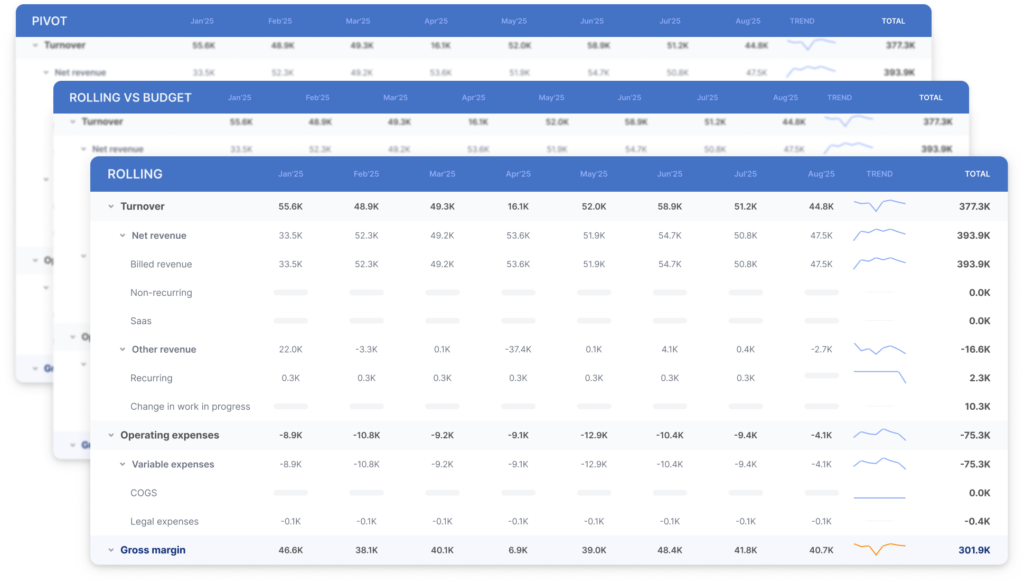
GL mapping, data enrichment, and drill-down
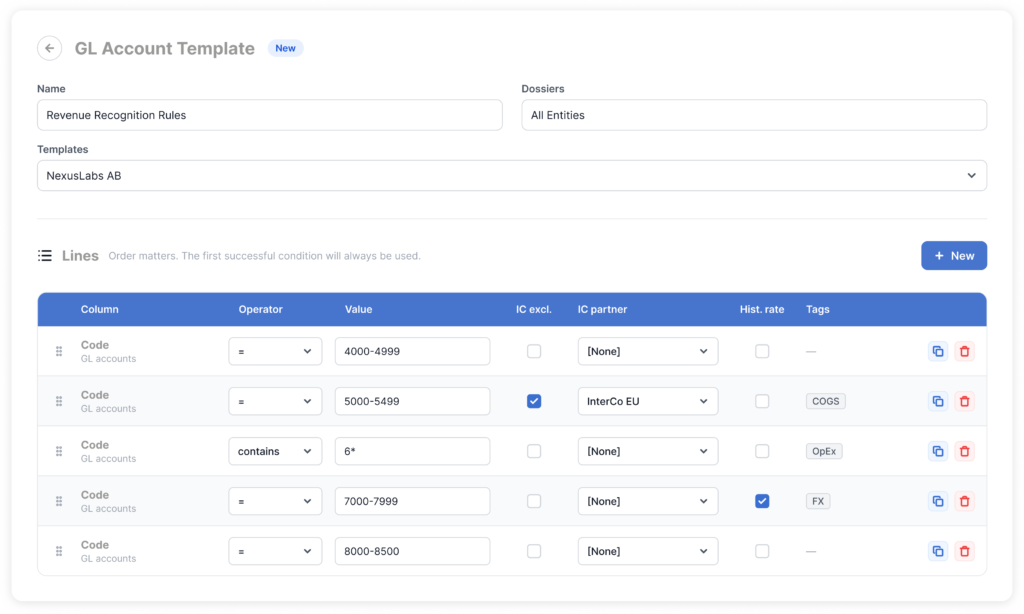
AI-assisted mapping suggestions match your GL accounts to your financial statements, so you approve instead of building the mapping by hand. Add management adjustments directly in the tool without touching your ERP, and drill down from any total to the underlying entries.
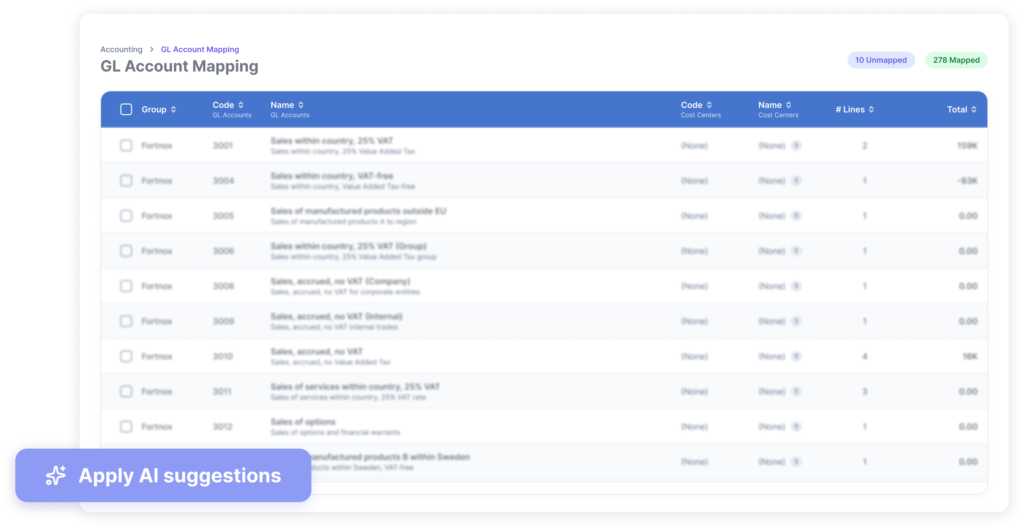
Flux analysis and insights
Compare balances period over period to see what moved and why, instead of re-deriving the story from a spreadsheet every close.
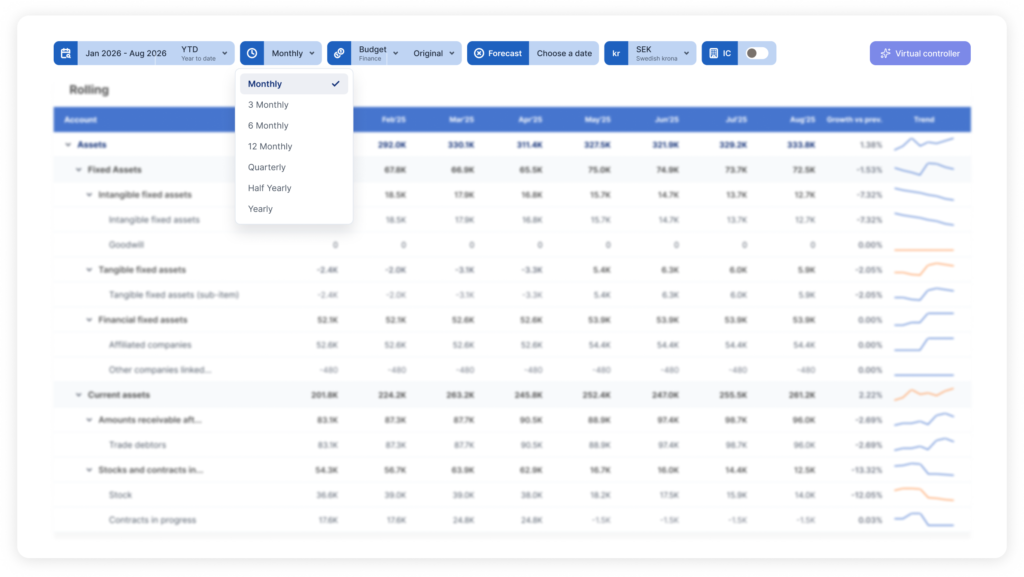
Multi currency
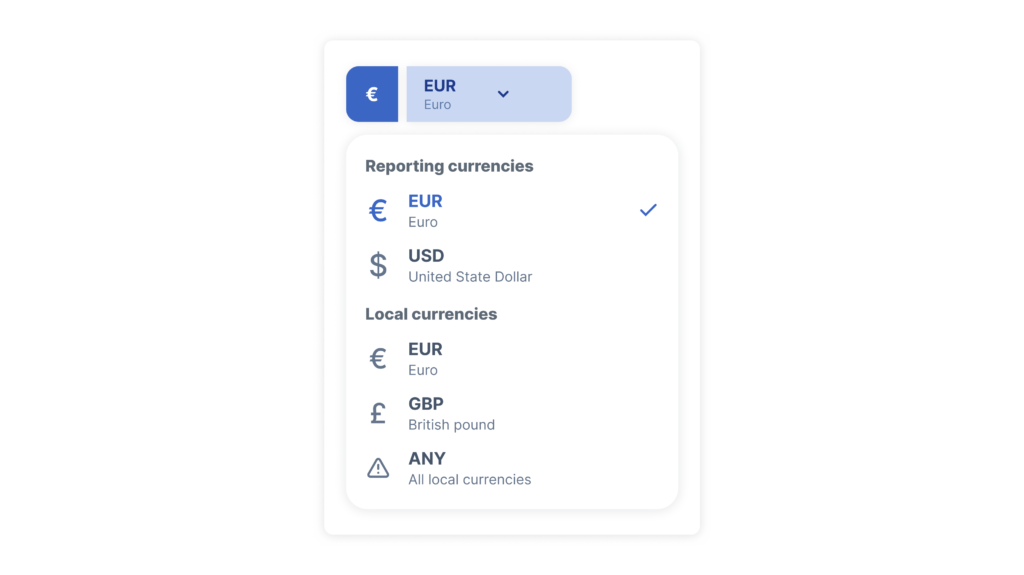
Report in the currencies your business actually runs in. Differences across entities and financial years are reconciled automatically, not adjusted by hand.
CTA calculation
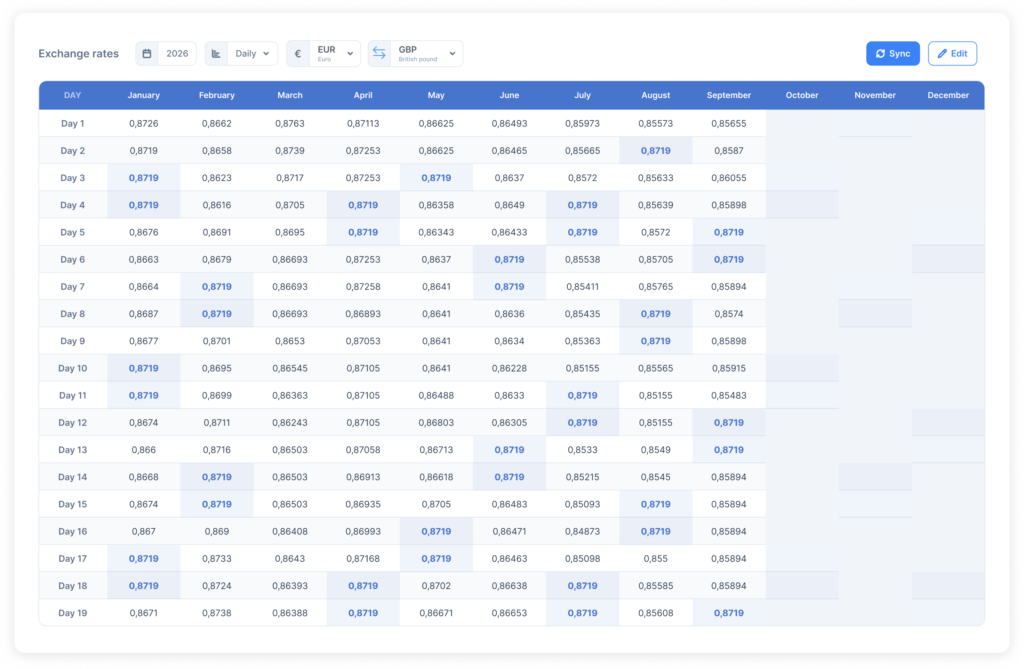
Currency translation adjustments are calculated automatically as part of your consolidated reporting, so translating foreign entity results doesn’t mean a separate manual step.
API functionality
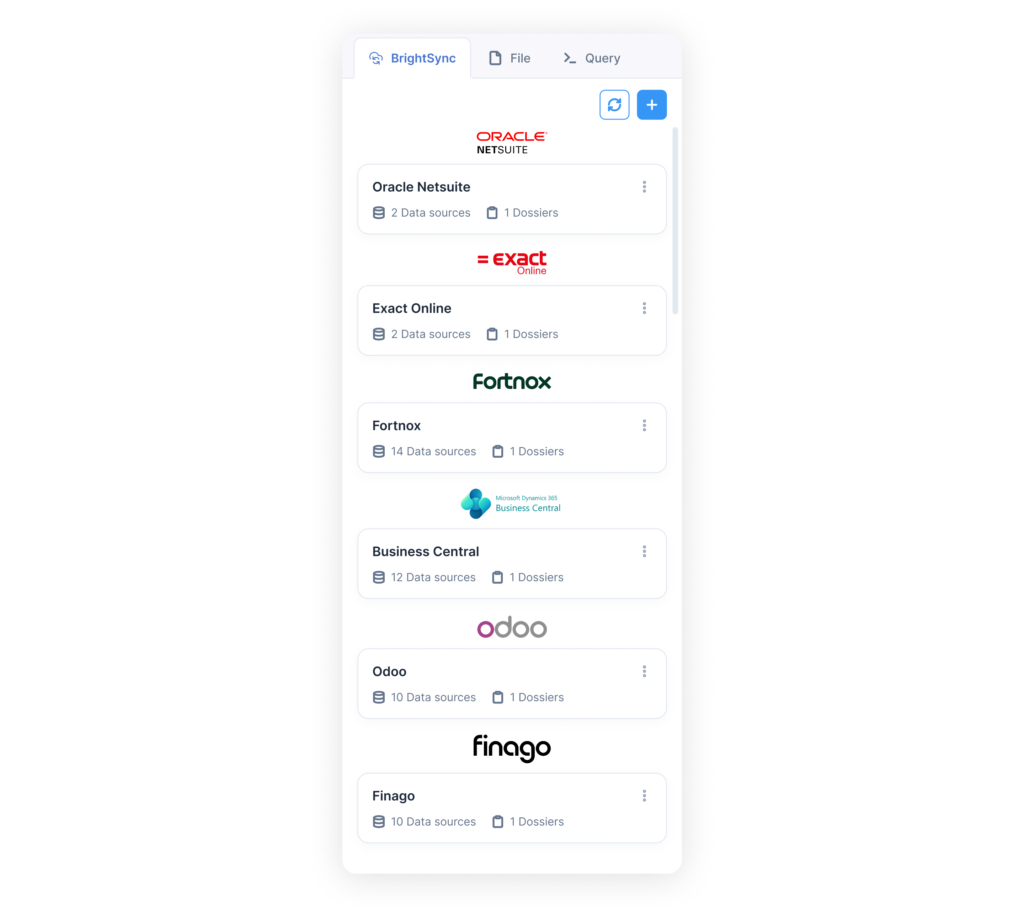
Connect BrightAnalytics to other systems through standard or custom APIs, so financial data can flow out to the tools that need it, not just in.
Additional reporting structures (ARS)
Build reporting structures beyond the standard chart of accounts, cost centers, departments, business lines, or whatever dimensions your business reports on.
Custom Financial Reporting (CFR)
Use our templates as a starting point or build your own reports from scratch in the admin panel, tailored to exactly what your business needs to see.
What makes us different


Discover our apps






- Who is BrightAnalytics?
BrightAnalytics is a growing technology company. Our goal is to help companies streamline their management reporting processes.
- What is BrightAnalytics?
BrightAnalytics is the most intuitive, reliable and fast management reporting platform that covers all needs on management reporting and consolidation.
- How does BrightAnalytics work?
- Connect: BrightAnalytics connects with accounting, ERP and CRM systems, and centralises all data in the BrightAnalytics platform.
- Report: The standard templates in BrightAnalytics are immediately ready for use, but can be fully tailored to suit one’s needs.
- Analyse: The management reports and dashboards offer a wealth of information and immediately provide clear insight into the figures of the entire organisation.
- Engage: The clear reports contribute to a better streamlined business strategy and execution, and ensure transparency within the company.
- How do I connect BrightAnalytics to my package?
With our BrightSync we connect to more than 400 data sources. One of the biggest USP’s of the solution is our possibility to connect with every system.