
Operations
Unify your sales, HR, and project data into a single, real-time operational picture. No manual spreadsheets required.
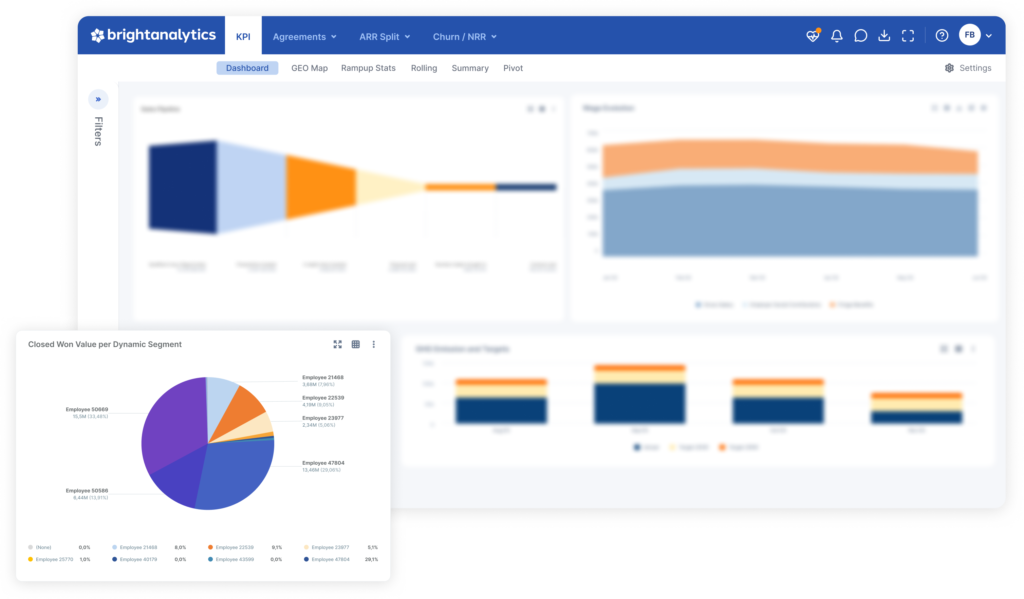
See how the business is really running, not just the numbers behind it
Financial reports tell you what happened. Operational data tells you why. BrightAnalytics connects your CRM, ERP, and time-tracking tools directly to the same data foundation as your financial reporting, so sales, HR, and project teams get a daily view of performance without waiting on finance to pull it together.
Overview
Stop collecting data manually across departments. Our operational apps bring metrics from sales, HR, and project management together on a single platform so you can see how your business is actually performing.
Sales pipeline & deals
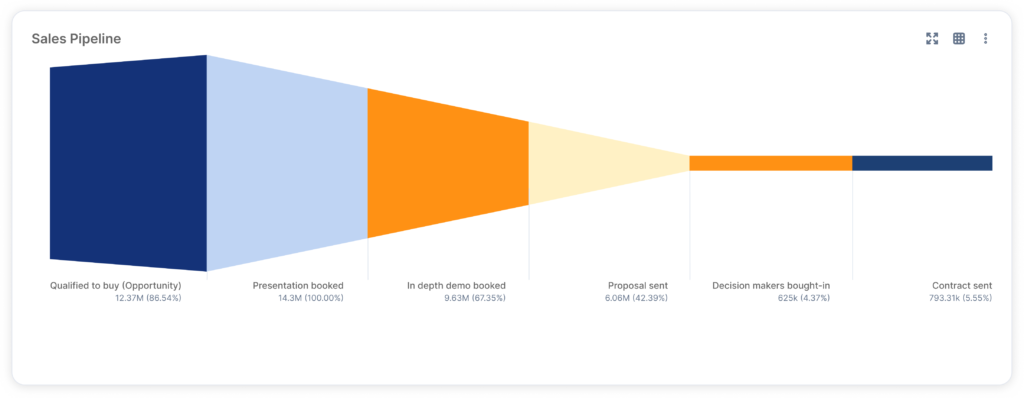
Track every deal from open to closed. See deal value by stage, win rates, and average time to close, and set targets by sales rep or team. Follow what your team does day to day alongside the pipeline and deal outcomes they produce. This makes it easy to analyze performance and forecast future revenue with confidence.
Invoices & orders
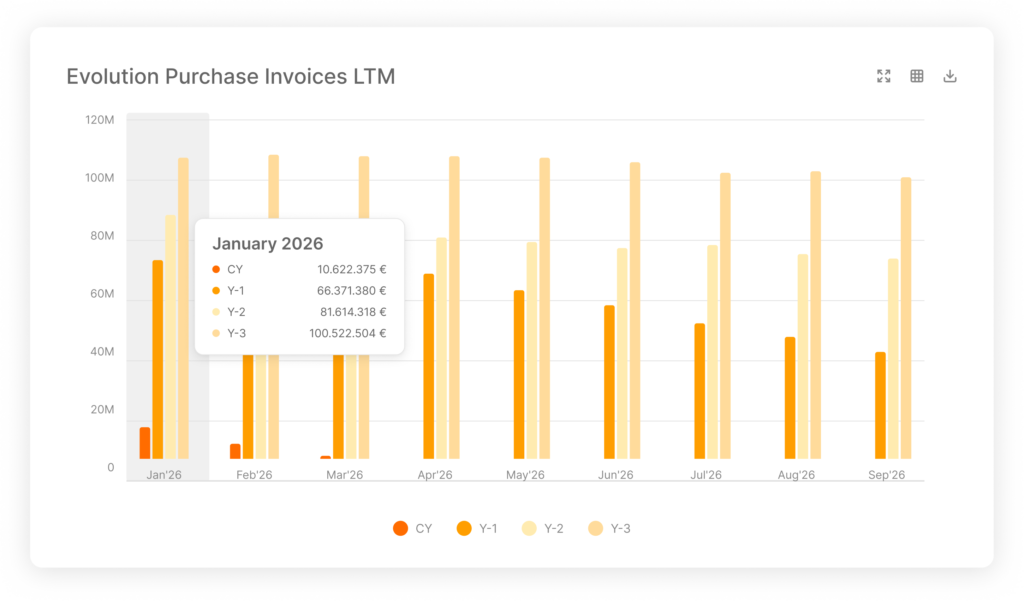
Compare sales orders against invoices, budget by customer or item, and spot your top clients, products, and sales employees at a glance.
Recurring invoicing
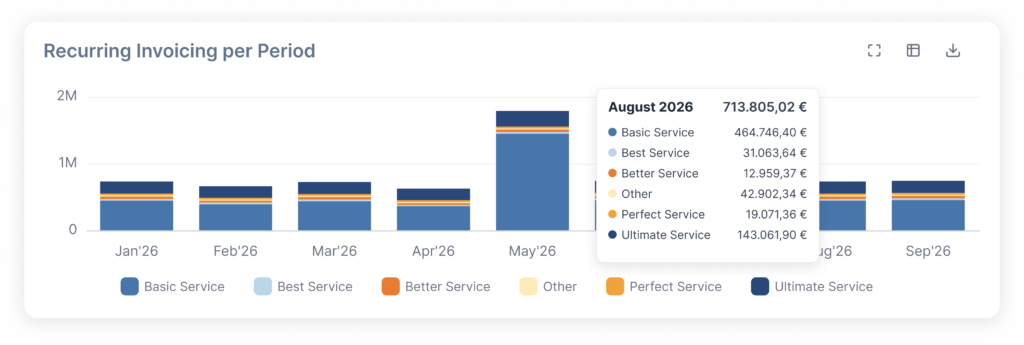
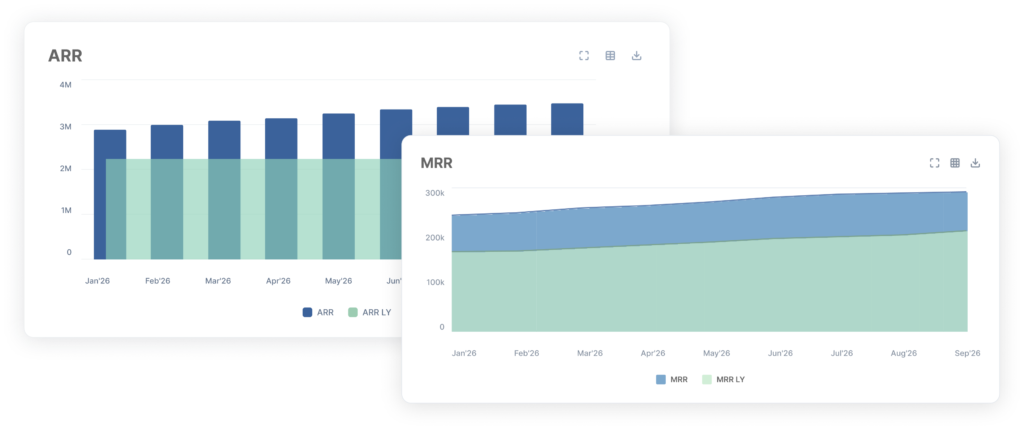
Separate your recurring revenue from one-time orders to see how your business is really growing. Compare active contracts against actual invoiced amounts to catch billing discrepancies early, track project budgets, and monitor MRR, ARR, and churn in one view.
SaaS metrics
Track ARR, MRR, churn, and expansion in real time. Combine subscription data with accounting actuals to monitor customer lifetime value and retention without manual spreadsheet formulas
Billability
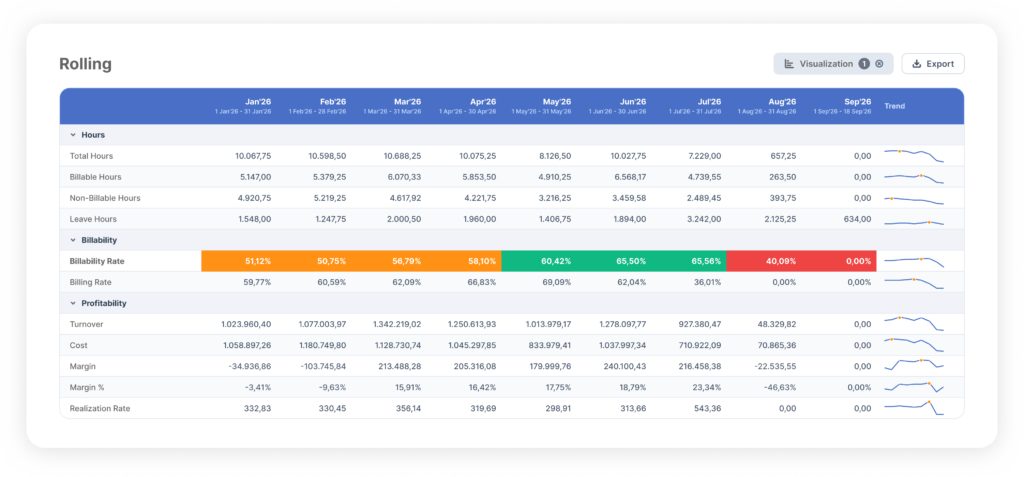
Track billable, non-billable, and leave hours in real time, broken down by project, team member, or client, so you know where your capacity is actually going.
HR reporting
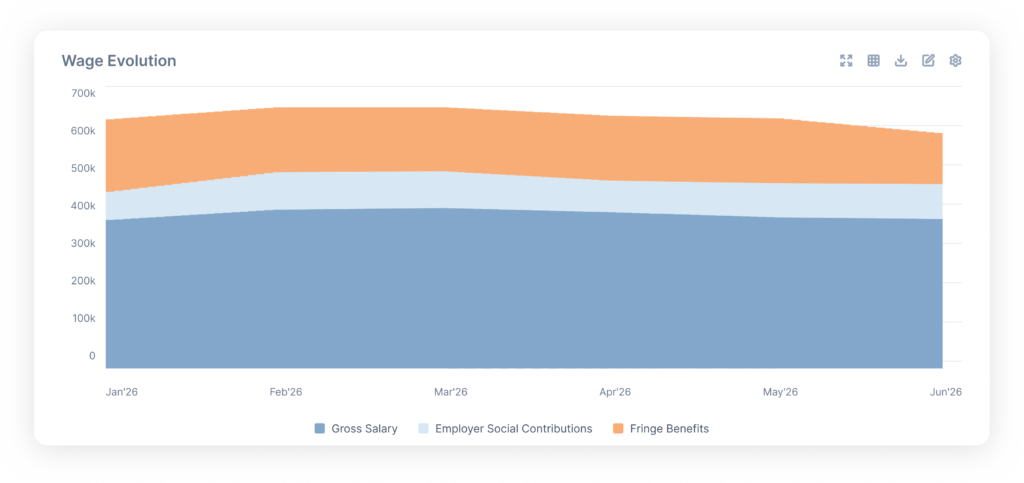
See headcount, hours, and payroll in one view. Track planned versus unplanned absence and training time to spot pressure points before they affect delivery.
Temporary staffing & engagements
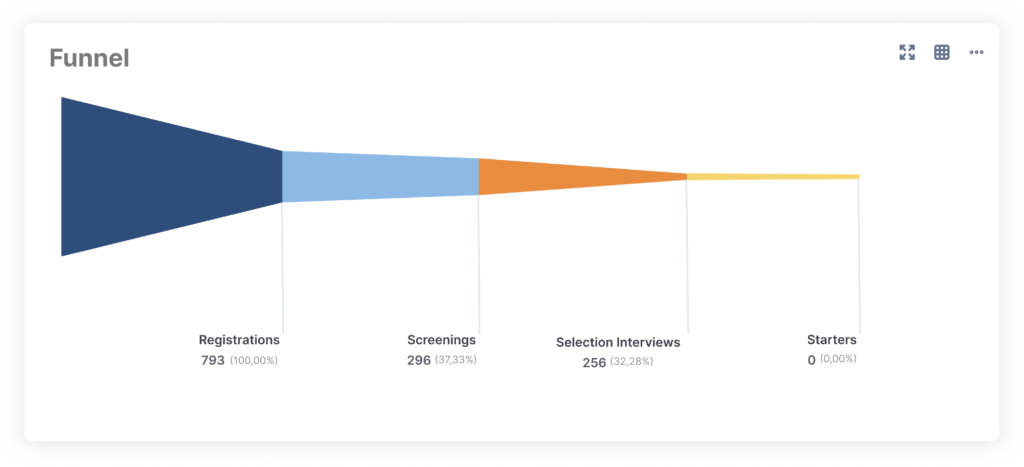
Report on temporary employment contracts and turnover, cost, and margin per contract, down to individual clients and workers. Track applicant and interview activity through to placement.
ESG reporting
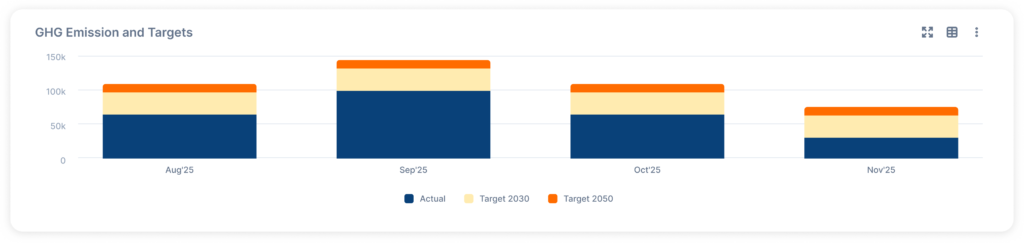
Cover your mandatory ESG KPIs automatically, with the option to add your own. Track employee and fleet data and set targets you can monitor over time.
Discover our apps







- Who is BrightAnalytics?
BrightAnalytics is a growing technology company. Our goal is to help companies streamline their management reporting processes.
- What is BrightAnalytics?
BrightAnalytics is the most intuitive, reliable and fast management reporting platform that covers all needs on management reporting and consolidation.
- How does BrightAnalytics work?
- Connect: BrightAnalytics connects with accounting, ERP and CRM systems, and centralises all data in the BrightAnalytics platform.
- Report: The standard templates in BrightAnalytics are immediately ready for use, but can be fully tailored to suit one’s needs.
- Analyse: The management reports and dashboards offer a wealth of information and immediately provide clear insight into the figures of the entire organisation.
- Engage: The clear reports contribute to a better streamlined business strategy and execution, and ensure transparency within the company.
- How do I connect BrightAnalytics to my package?
With our BrightSync we connect to more than 400 data sources. One of the biggest USP’s of the solution is our possibility to connect with every system.