Management reporting solutions
Stop guessing, start growing.
We offer the plug & play solution for consolidated management reporting: a single platform where we centralise all your operational and financial data, instantly transforming raw numbers into insights, dynamic dashboards, and management reports that reveal the true performance story across your entire organisation, including Finance, Operations, Consolidation, and ESG.

Financial reporting
BrightAnalytics is your all-in-one platform for financial reporting, and it goes far beyond standard metrics. It collects data from all your sources and turns it into clear financial statements, budgets, forecasts, and consolidations. You can streamline workflows, manage accounting entries, automate allocations, and more. In short, we give you the apps you need to take full control of your financial management.
- Management reporting
- Budgeting and forecasting
- Cash management
- Consolidation
- Operational insights
Consolidation
BrightAnalytics is your centralised platform for fast, transparent consolidation. It brings together data from all your entities and turns it into clear, compliant legal consolidations. The real power lies in automation: AI-driven intercompany matching and intelligent exception handling eliminate manual work and guarantee one single version of the truth. We provide you with the apps you need for:
- Advanced Consolidation
- Intercompany Reconciliation
- Multi-Currency Reporting

Operational reporting
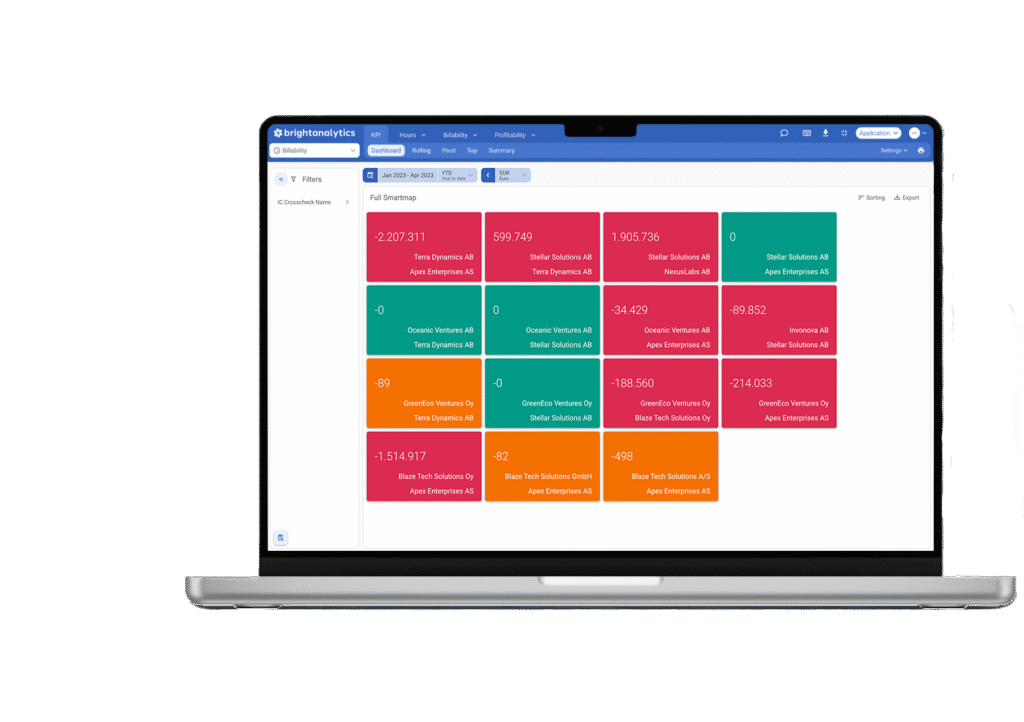
We connect with your existing systems including CRM, ERP and time tracking tools, so your data flows effortlessly into one place. The platform turns that information into clear operational insights that go well beyond the financial view and gives you a daily 360° understanding of how your business is performing across the organisation. Every sector works differently, so we offer sector-tailored solutions that help you get the most value out of your data. You can also empower your teams by giving them the access they need to follow their own results.
- Billability
- SaaS-Metrics
- Margin Reporting
- Sales Activity
- Project Reporting
- …

ESG reporting
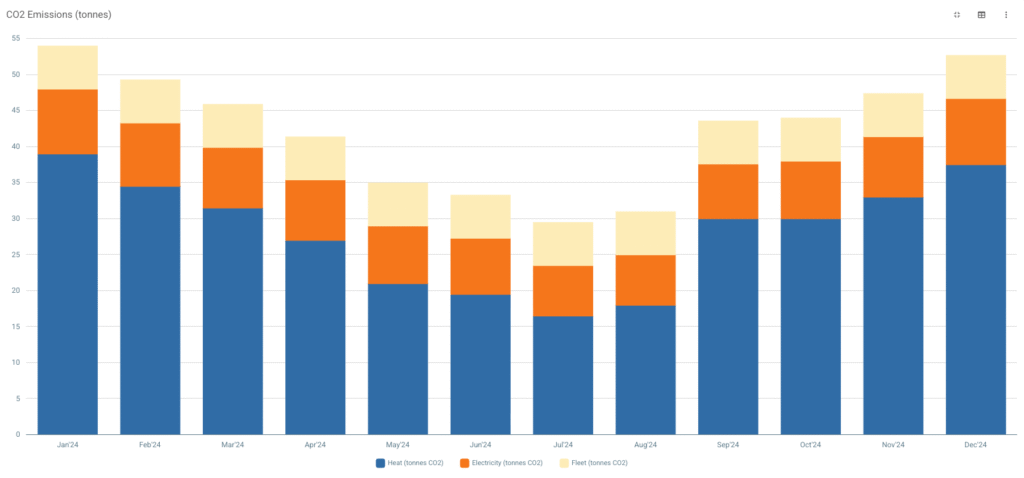
Manage your Environmental, Social, and Governance responsibilities.
With our ESG apps, you can streamline your ESG reporting processes, ensuring seamless adherence to legal obligations with minimal effort.
- ESG Management
- Measure your ESG performance with customised KPI’s and statistics
- Fleet Admin
- …
- Finance & Cash
Centralize your accounting systems with one powerful tool. Get accurate, automated management reports for your finance team.
- Consolidated financial reporting
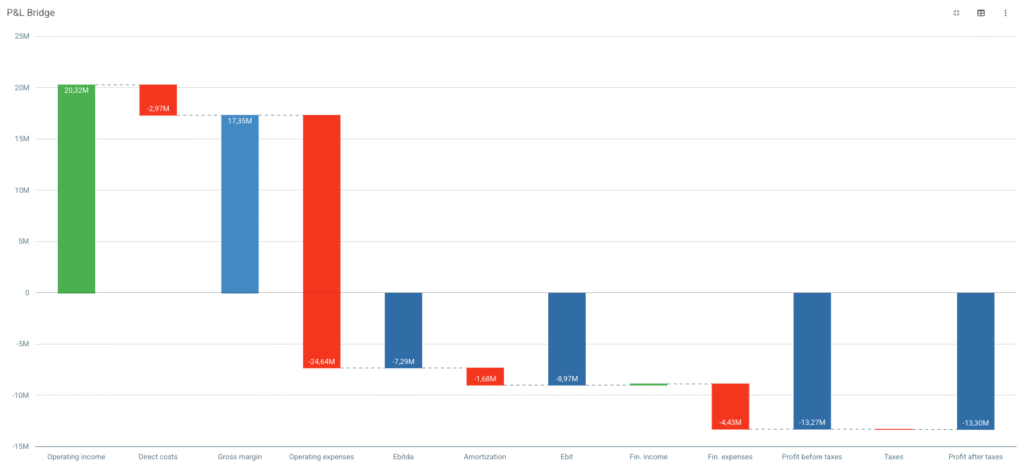
Visualise P&L, balance sheet and cash flow instantly, switch between dashboards and deep-dive analyses.

- Profit & Loss
- Balance sheet
- Ratio
- Cash flow statements
- Multi-currency
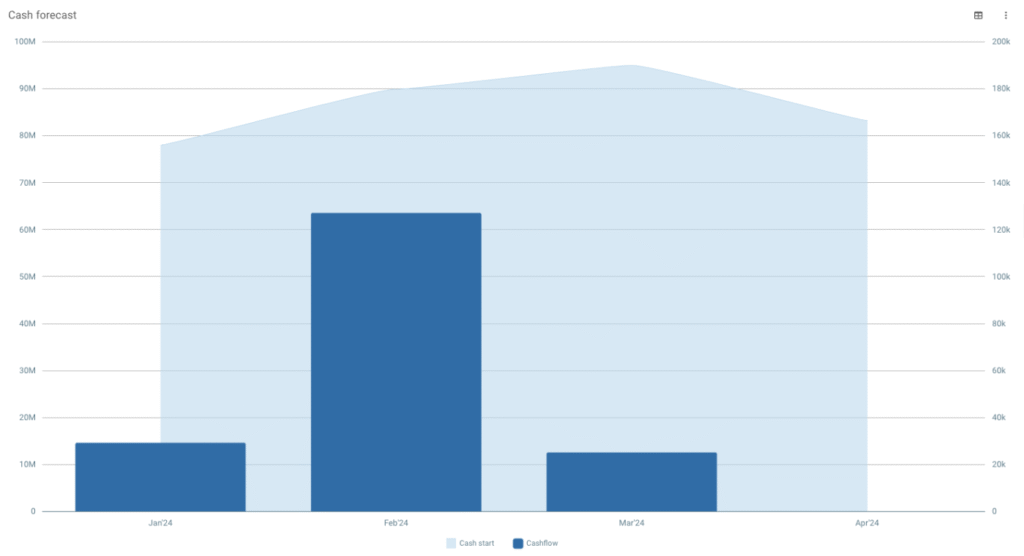
Cash forecastingForecast cash balances accurately, combining historical data, budgets, working capital ratios and planned investments
 Controlling
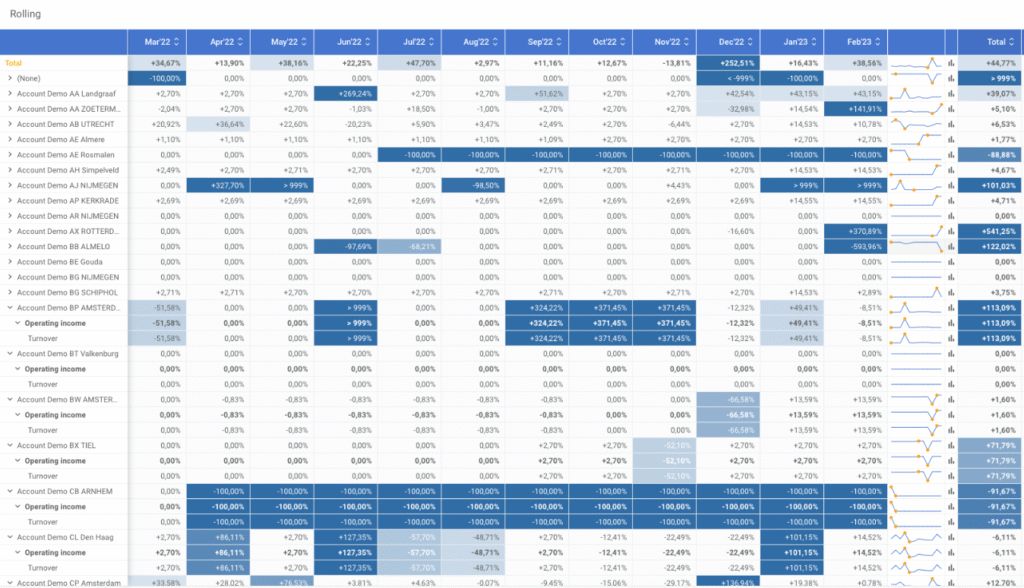
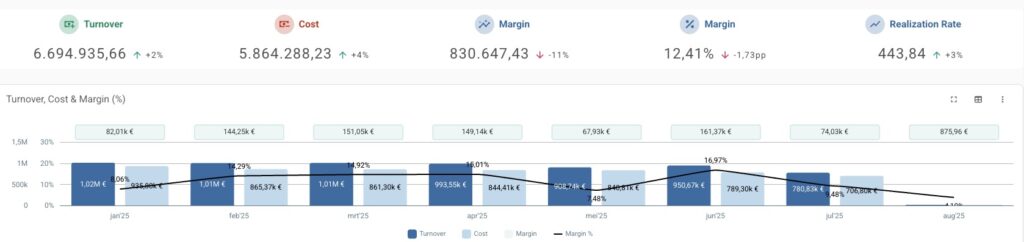
Track your key revenues and expenses, reveal hidden costs and discover new savings opportunities,
 Customers & suppliers
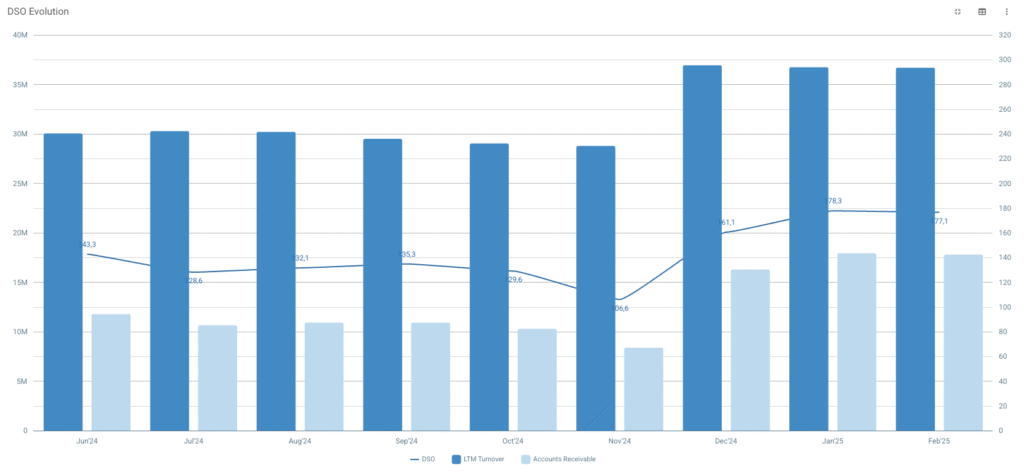
Analyse payment behavior with DSO and DPO metrics, gaining clear insights into customer and supplier habits.

- Consolidation
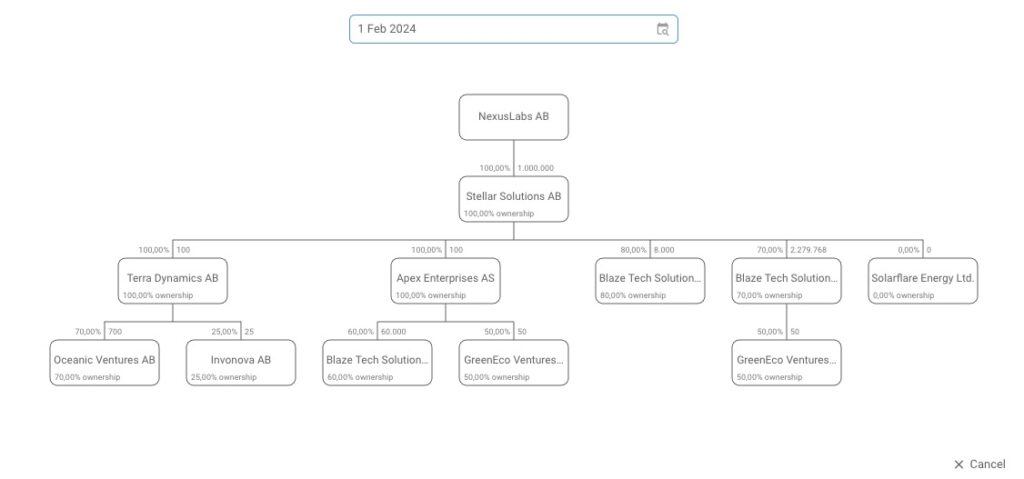
Master complex group structures with automated entries, locked data and AI-driven intercompany matching for accurate consolidation.
- Advanced consolidation
Track key shareholder events like acquisitions, share issuances and dispositions while capturing voting and financial rights.

- Equity consolidation
- Shareholder register
- Deffered taxes
- Dynamic ownership
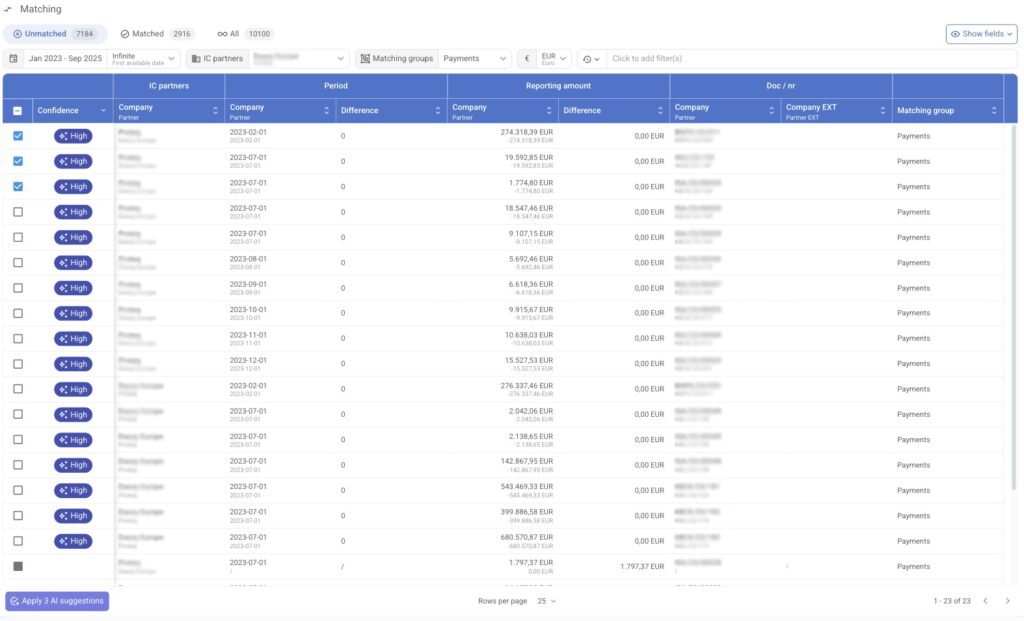
IC reconciliationTransform intercompany reconciliation with AI-driven matching, intelligent exceptions and automatic adjustments.

- Operations
Centralise key operational data and automate insights from sales, margins & HR, for accurate and consistent reporting.
- SaaS Metrics
Optimise pricing, uncover upselling opportunities and boost customer satisfaction, all backed by real-time data.
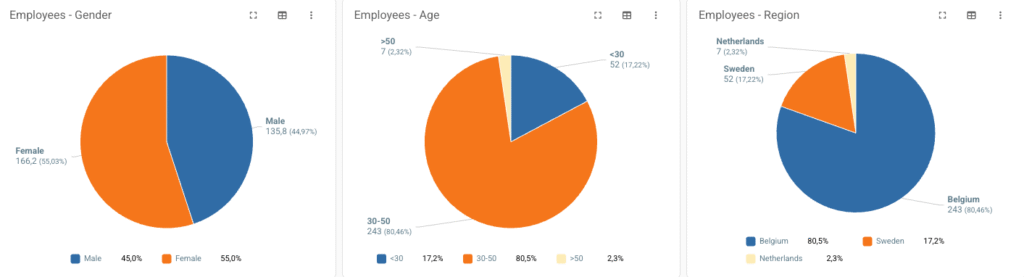
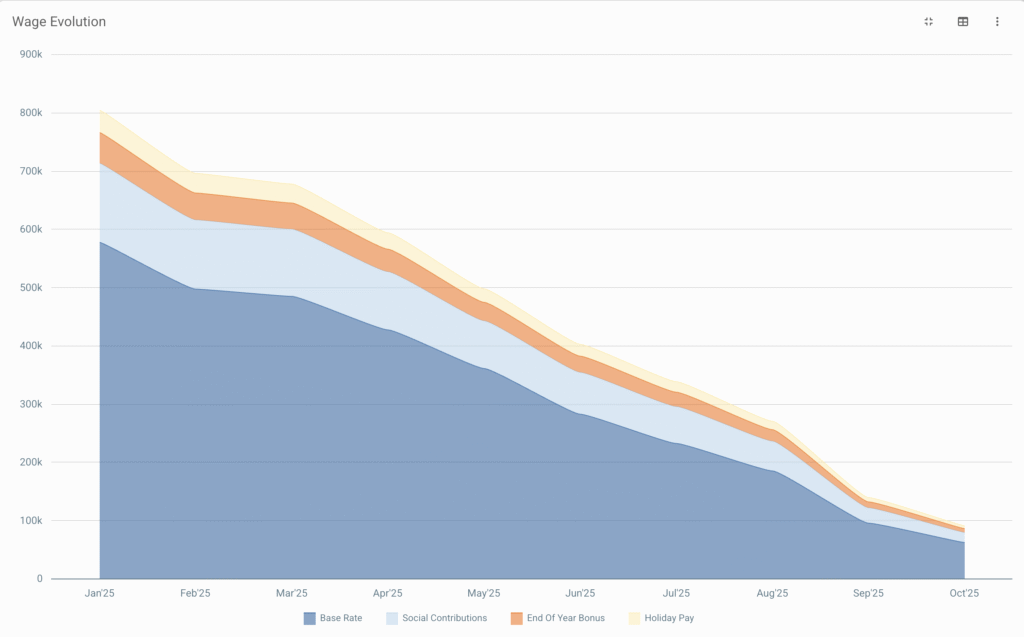
 HR Analytics
Analyse working hours, planned vs unplanned absences and training time to optimise productivity across every department.
 Billability
Track billable, non-billable and leave hours in real-time, providing comprehensive reports by project, team member or client.
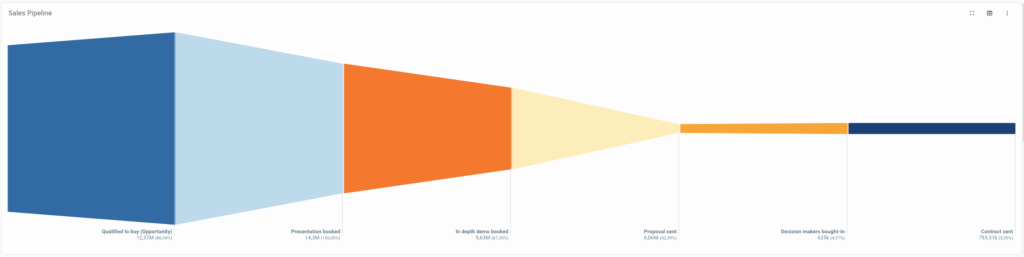
 Pipeline & Deals
Gain real-time visibility into every stage of your sales funnel to track deals, analyse outcomes and boost team performance with confidence.

- ESG
Streamline ESG reporting, ensure full compliance, and take control of your sustainability performance.
Visualise P&L, balance sheet and cash flow instantly, switch between dashboards and deep-dive analyses.
- Profit & Loss
- Balance sheet
- Ratio
- Cash flow statements
- Multi-currency
Forecast cash balances accurately, combining historical data, budgets, working capital ratios and planned investments
Track your key revenues and expenses, reveal hidden costs and discover new savings opportunities,
Analyse payment behavior with DSO and DPO metrics, gaining clear insights into customer and supplier habits.
Track key shareholder events like acquisitions, share issuances and dispositions while capturing voting and financial rights.
- Equity consolidation
- Shareholder register
- Deffered taxes
- Dynamic ownership
Transform intercompany reconciliation with AI-driven matching, intelligent exceptions and automatic adjustments.
Optimise pricing, uncover upselling opportunities and boost customer satisfaction, all backed by real-time data.
Analyse working hours, planned vs unplanned absences and training time to optimise productivity across every department.
Track billable, non-billable and leave hours in real-time, providing comprehensive reports by project, team member or client.
Gain real-time visibility into every stage of your sales funnel to track deals, analyse outcomes and boost team performance with confidence.
Security and technology. Bright priorities
BrightAnalytics guarantees the security of your data. Day in, day out, we work on safety through people, through technology and through processes.
- Who is BrightAnalytics?
BrightAnalytics is a growing technology company. Our goal is to help companies streamline their management reporting processes.
- What is BrightAnalytics?
BrightAnalytics is the most intuitive, reliable and fast management reporting platform that covers all needs on management reporting and consolidation.
- How does BrightAnalytics work?
- Connect: BrightAnalytics connects with accounting, ERP and CRM systems, and centralises all data in the BrightAnalytics platform.
- Report: The standard templates in BrightAnalytics are immediately ready for use, but can be fully tailored to suit one’s needs.
- Analyse: The management reports and dashboards offer a wealth of information and immediately provide clear insight into the figures of the entire organisation.
- Engage: The clear reports contribute to a better streamlined business strategy and execution, and ensure transparency within the company.
- How do I connect BrightAnalytics to my package?
With our BrightSync we connect to more than 400 data sources. One of the biggest USP’s of the solution is our possibility to connect with every system.