
BrightAnalytics: a Finthesis alternative for consolidated management reporting
Looking for a Finthesis alternative? BrightAnalytics is a consolidated management reporting platform built for multi-entity groups, connected directly to your source systems so your numbers stay accurate and current.
Why companies choose BrightAnalytics
1. Financial and management reporting that adapts to you

Traditional tools often rely on static file exports like trial balances or the French Fichier des Écritures Comptables (FEC), which have to be exported, uploaded, and mapped before anyone can look at the numbers. BrightAnalytics reads your data straight from your source systems, so your P&L, balance sheet, cash flow, and management reports are ready to analyze as soon as the numbers land.
- P&L, balance sheet, and cash flow: Work from dashboards that are ready from day one, with rolling views, comparisons, and pivot tables. The balance sheet follows the same structure as the P&L, so switching between them is easy.
- General ledger translations and mapping: AI translates and standardizes account names across countries and maps them to your financial statements, so management reports stay consistent across the group.
- Reporting structures beyond the chart of accounts: Report on cost centers, departments, business lines, or any other dimension your business uses.
- Management adjustments: Add adjustments directly in BrightAnalytics without touching your ERP.
- Custom reports and KPIs: Start from templates or build your own reports, and track as many financial ratios and KPIs as your business needs.
- Multi-currency reporting: Report in the currencies your business runs in, with currency translation adjustments calculated automatically.
2. AI that takes care of the routine checks
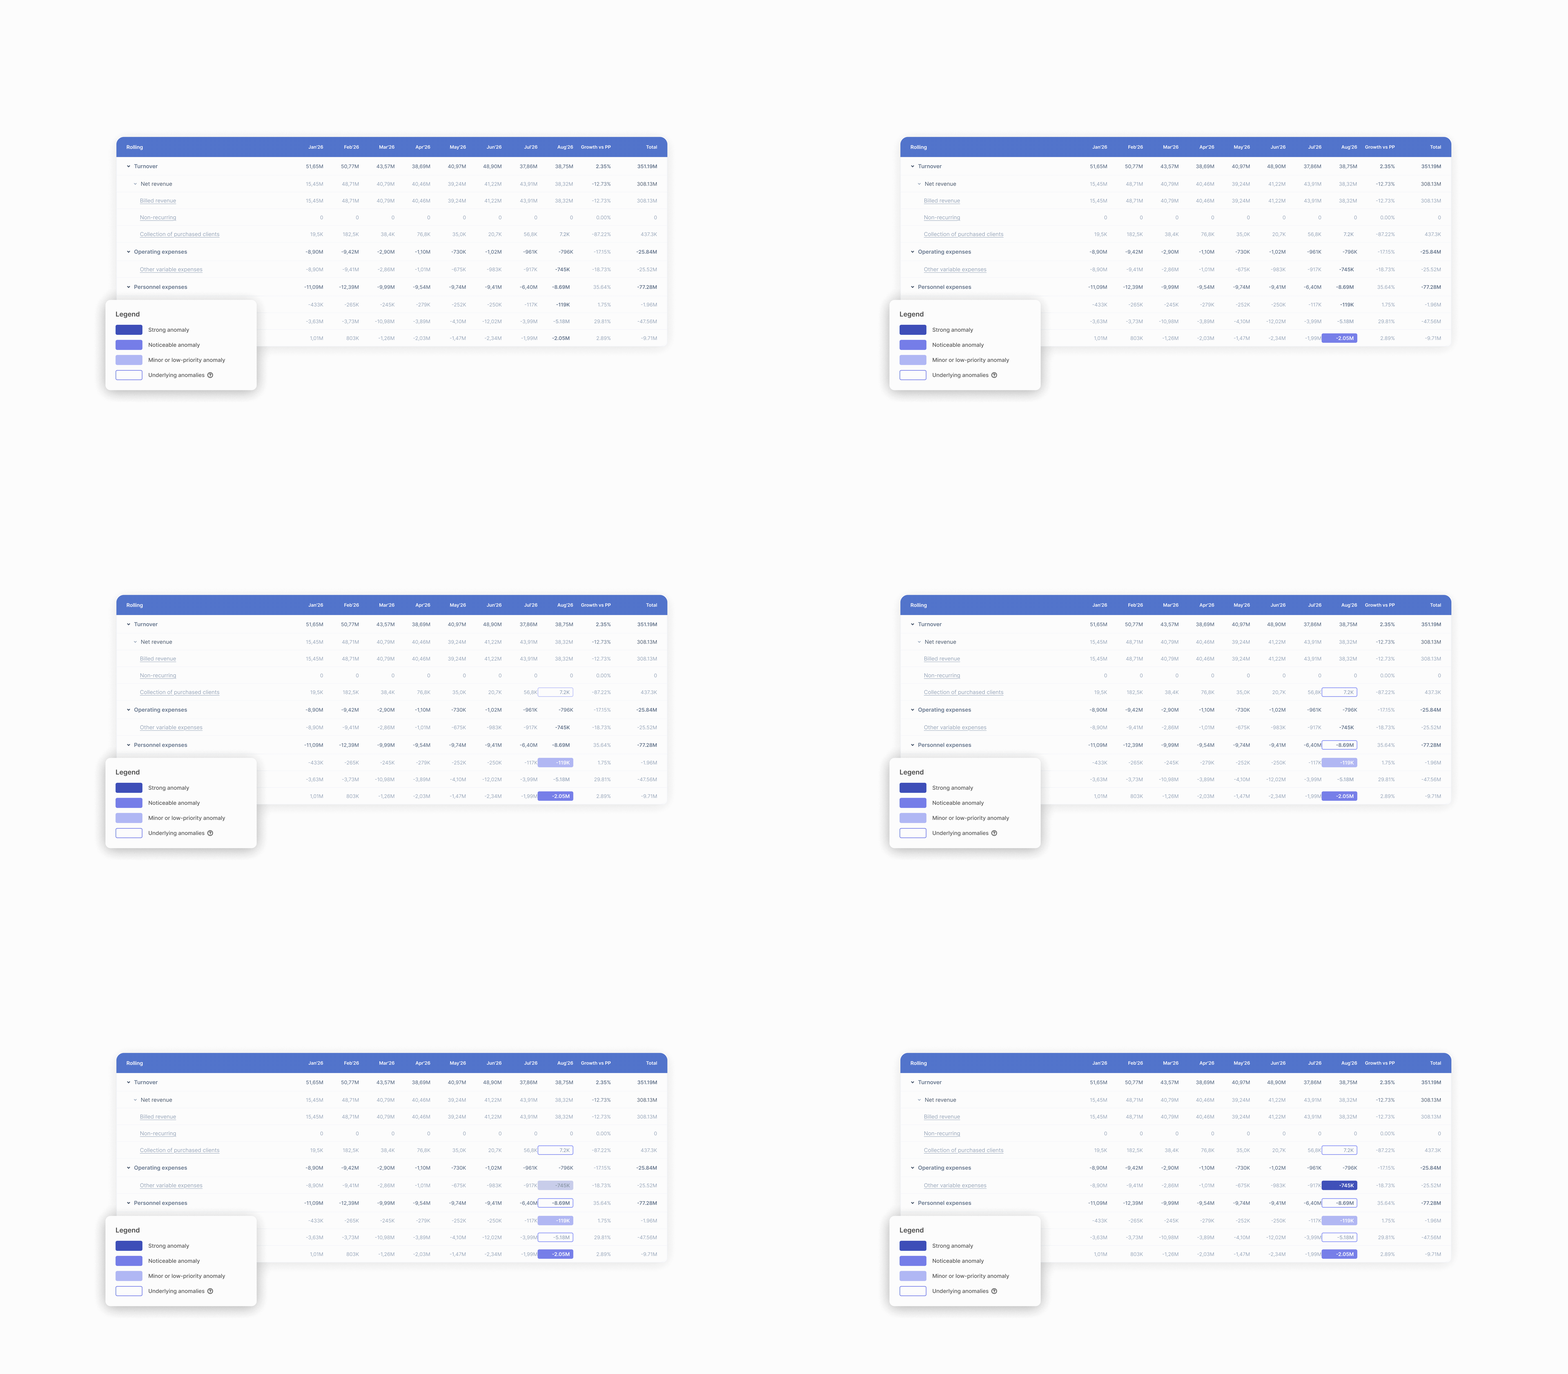
Most of the time spent on reporting goes into checking the numbers rather than reading them. BrightAnalytics uses AI to handle those checks and point you to what needs attention, so your team can focus on what the numbers mean for the business.
- Anomaly detection: An AI controller compares your current reports against past periods and flags unexpected cost spikes or unusual postings before you close the books.
- AI flux analysis: Compare balances period over period, with AI highlighting what changed and what’s driving it.
- AI insights: Get clear summaries of your numbers, with trends, deviations, and the drivers behind your results highlighted for you.
- Plain-language analysis: Ask questions about the report you’re looking at, or have AI agents monitor budget variances and creeping costs.
- Intercompany matching as you grow: For groups with more intercompany activity, AI suggests which transactions belong together and the bookings needed to close any gaps.
3. Self-service, without a specialist on standby
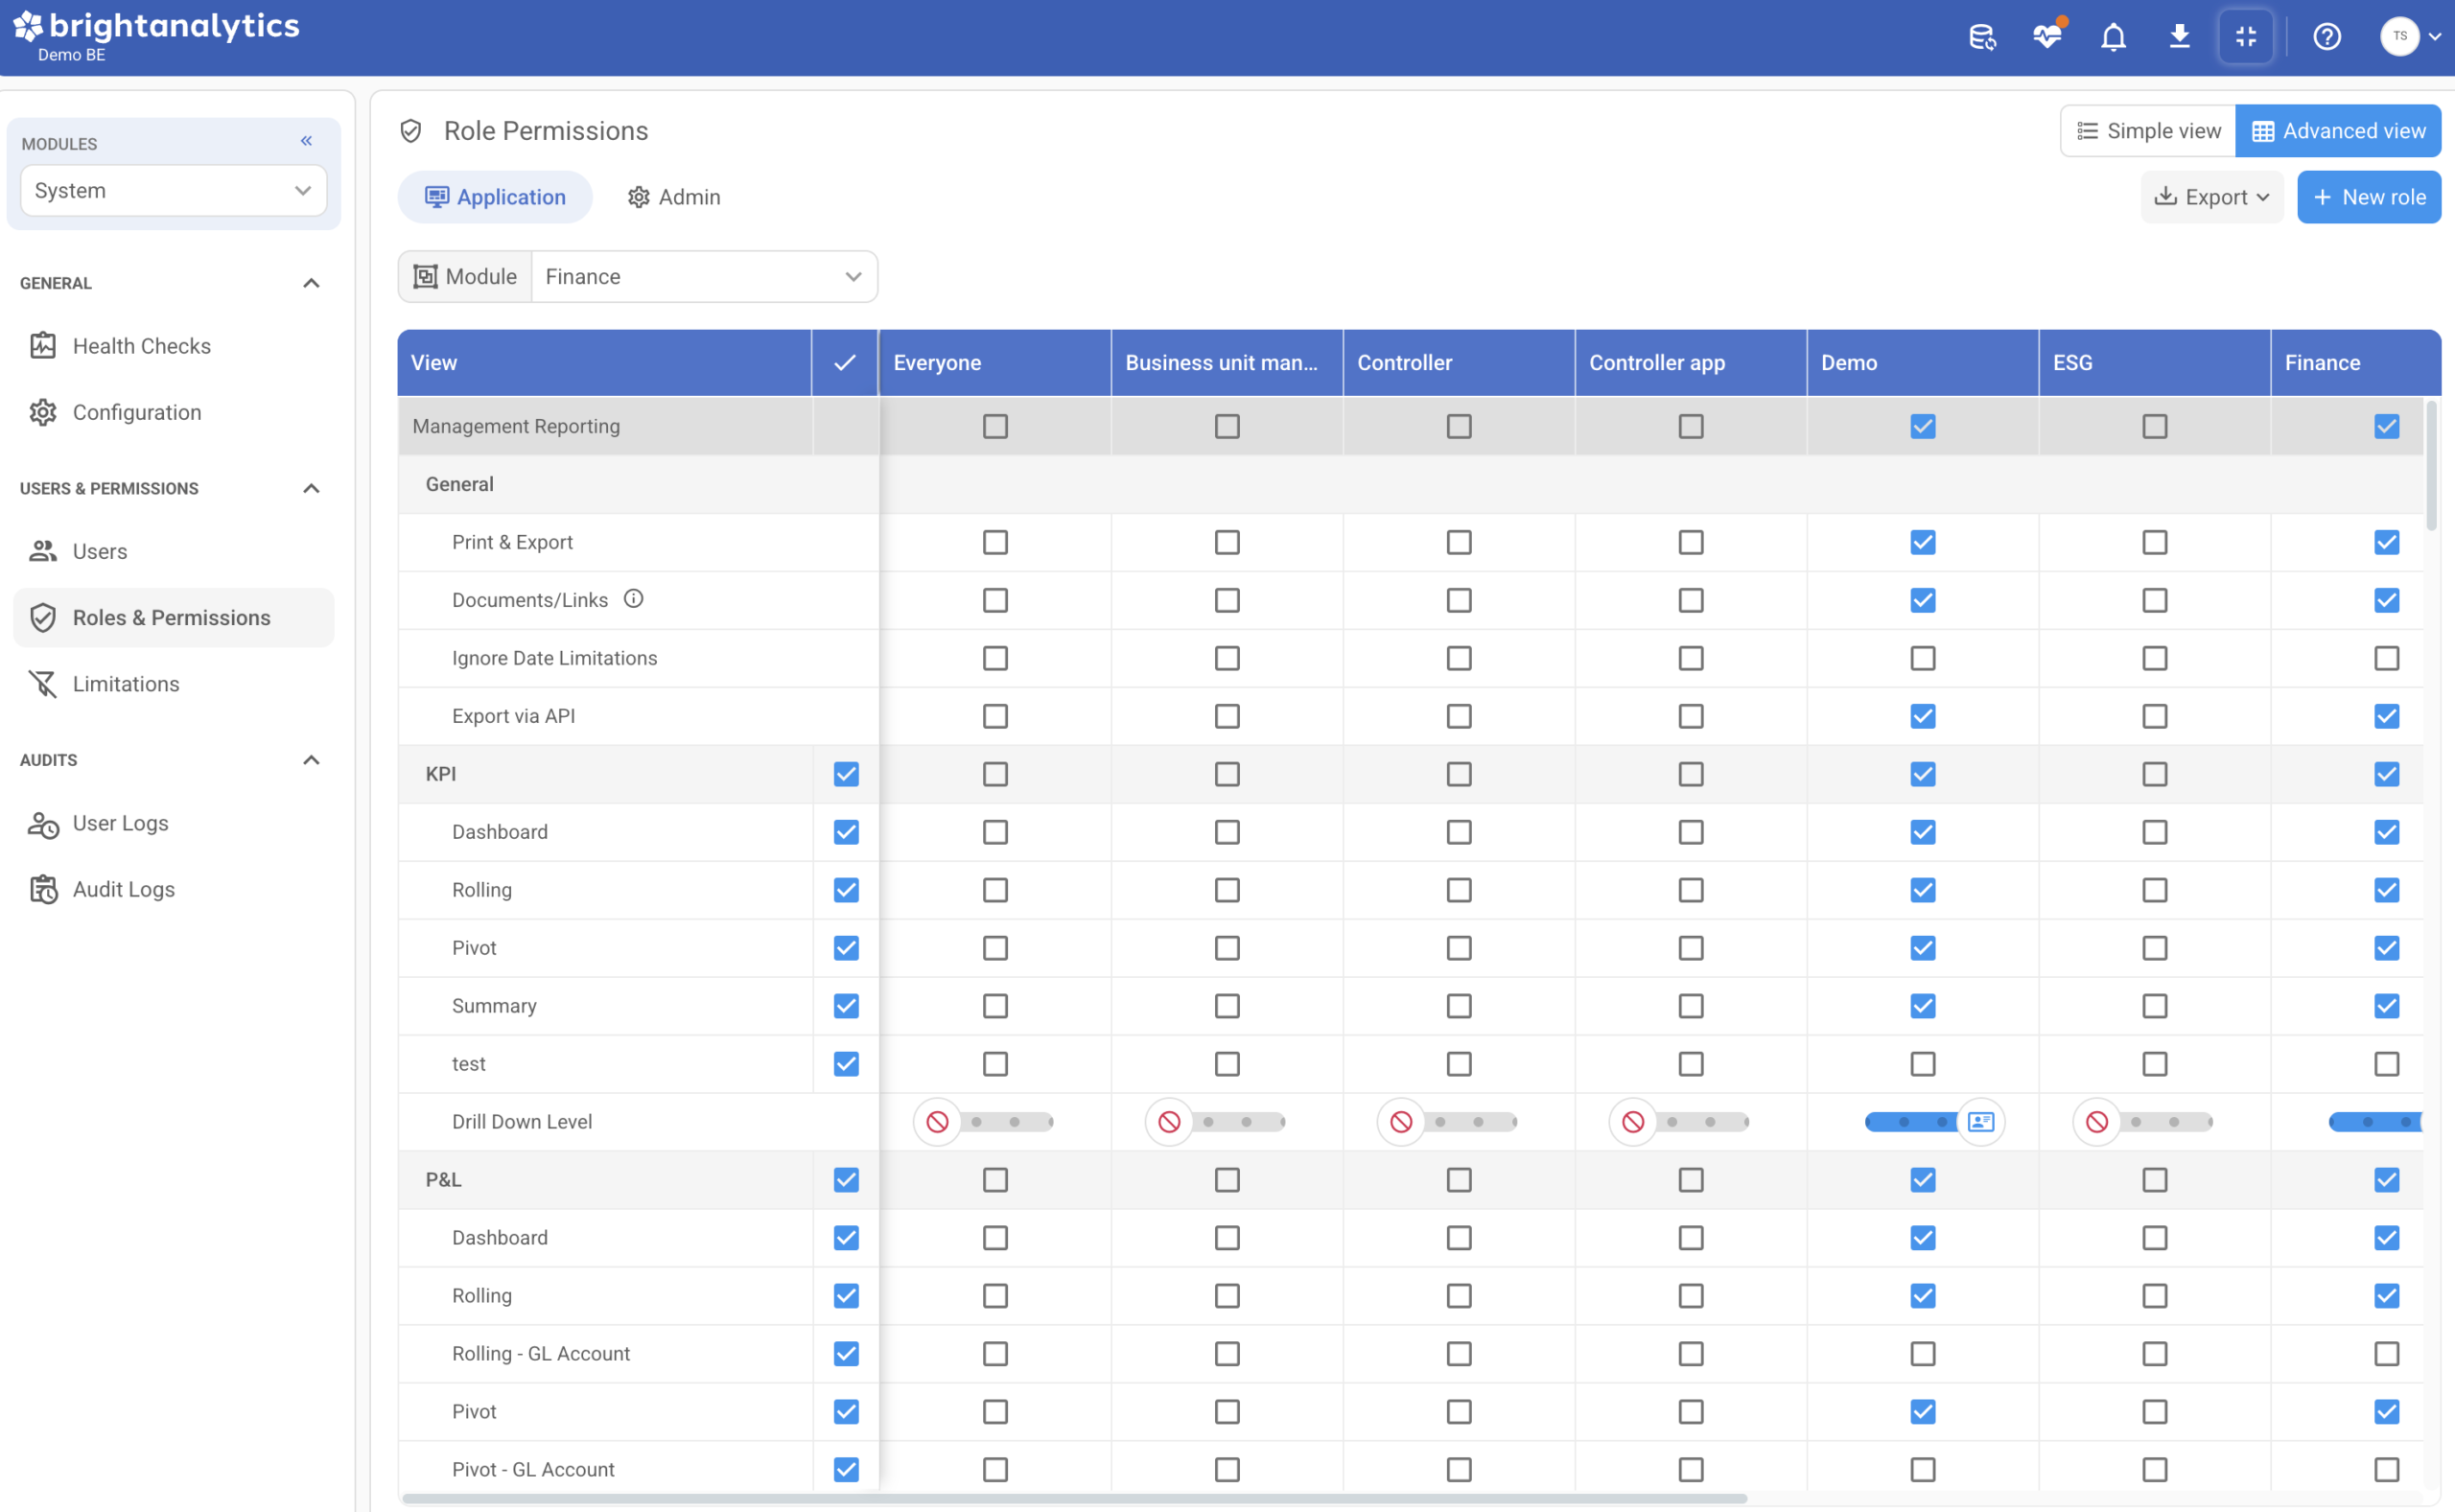
Customers consistently tell us BrightAnalytics is easy to use for finance and non-finance teams alike. The secret behind this is our admin panel. Instead of relying on rigid templates or waiting on external consultants for every adjustment, you hold the keys to your setup. You can change reporting structures, mappings, dashboards, and user access yourself.
- Smart monitoring: An AI controller monitors current reports against past periods to spot unexpected cost spikes or anomalies before you close the books.
- Plain-language analysis: Built-in AI agents let you ask questions to analyze active views or monitor budget variances and creeping costs.
- Deep data access: Slicing and dicing data, drilling into posting details and scanned invoices, and matching intercompany entries happen natively so eliminations balance to zero without you having to hunt for discrepancies.
4. Fast, direct integrations
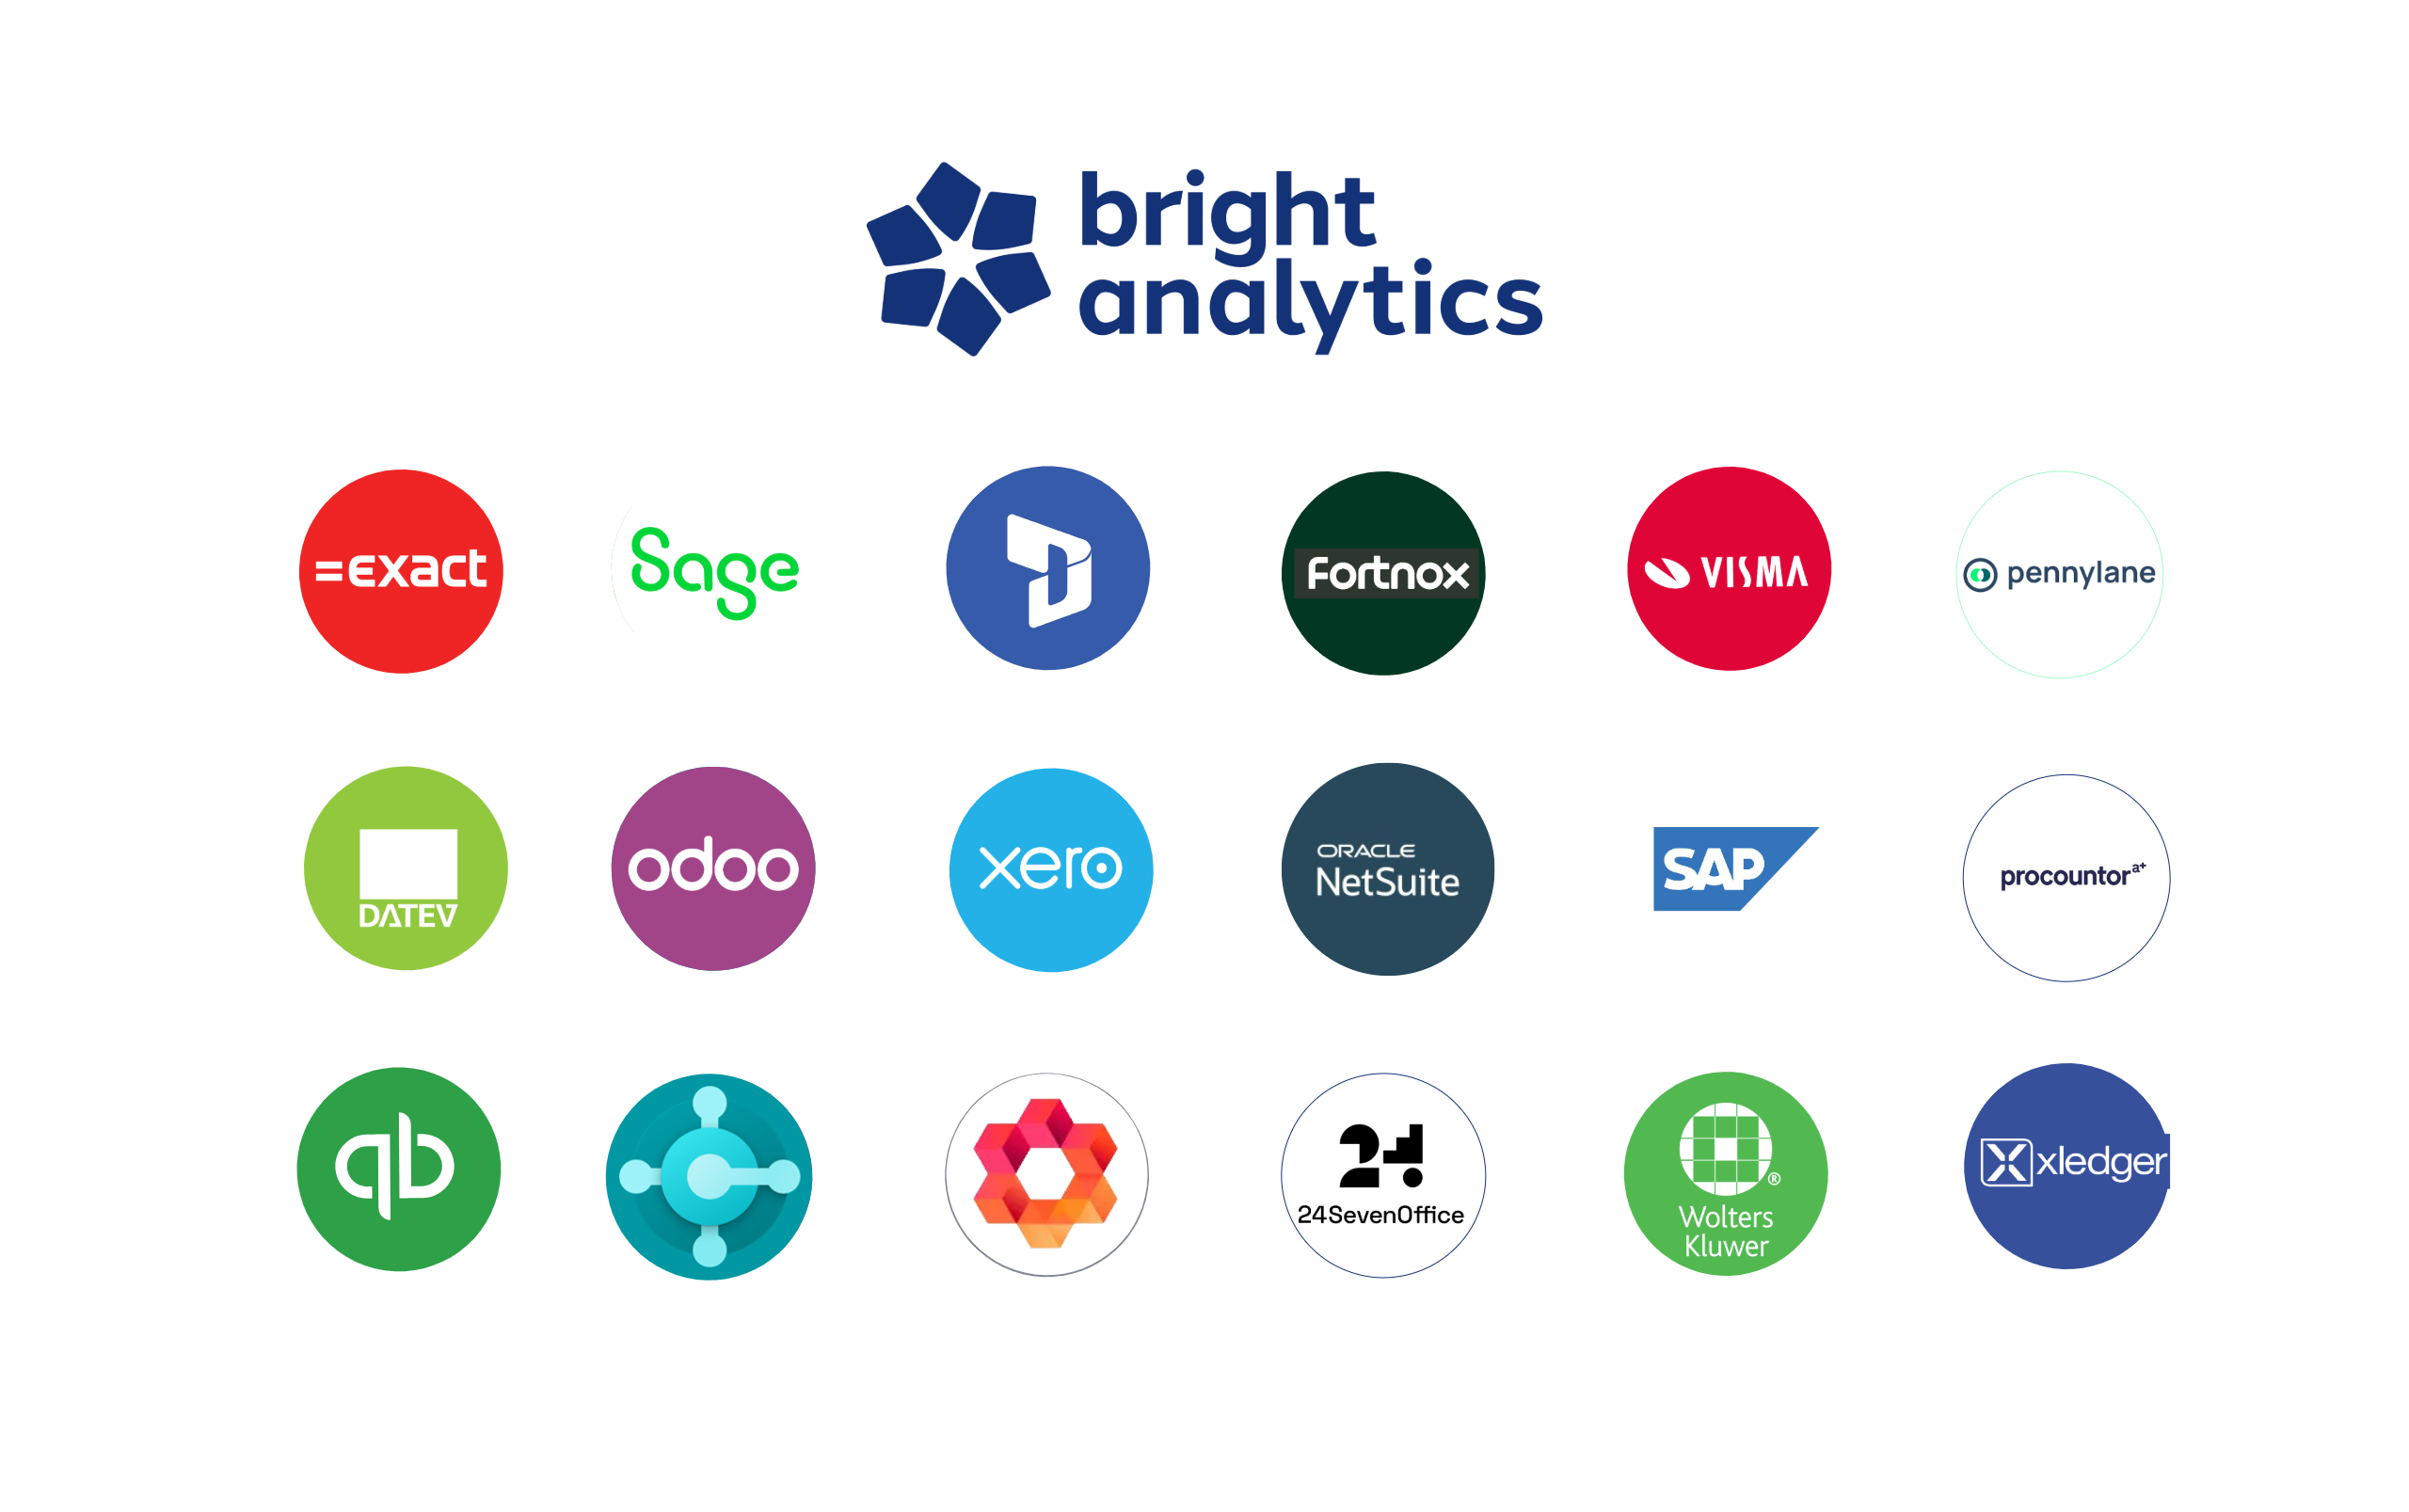
We connect to your systems, cloud or on-premise, with over 400 integrations already built. That includes French and European systems like Sage, Cegid, Pennylane, Exact Online, and Odoo, alongside global ERPs like SAP, Microsoft Dynamics, and NetSuite. If your system isn’t on the list, we typically build the connector in a matter of days.
BrightAnalytics data stays 100% aligned with your source systems: the built-in health check catches discrepancies between what’s reported and what’s booked, and you’ll get an email notification if a new general ledger account needs mapping. Data syncs every night, and you can hit refresh for an on-demand update whenever you need the latest figures during closing periods.

Ready to see how it works for your business?
Closing periods and board prep don’t have to mean long hours, manual file uploads, or waiting on external consultants for every report change. Request a demo to see how BrightAnalytics fits into your setup.
- What is BrightAnalytics?
BrightAnalytics is the most intuitive, reliable and fast management reporting platform that covers all needs on management reporting and consolidation.
- Who is BrightAnalytics?
BrightAnalytics is a growing technology company. Our goal is to help companies streamline their management reporting processes.
- How does BrightAnalytics work?
- Connect: BrightAnalytics connects with accounting, ERP and CRM systems, and centralises all data in the BrightAnalytics platform.
- Report: The standard templates in BrightAnalytics are immediately ready for use, but can be fully tailored to suit one’s needs.
- Analyse: The management reports and dashboards offer a wealth of information and immediately provide clear insight into the figures of the entire organisation.
- Engage: The clear reports contribute to a better streamlined business strategy and execution, and ensure transparency within the company.
- How do I connect BrightAnalytics to my package?
With our BrightSync we connect to more than 400 data sources. One of the biggest USP’s of the solution is our possibility to connect with every system.